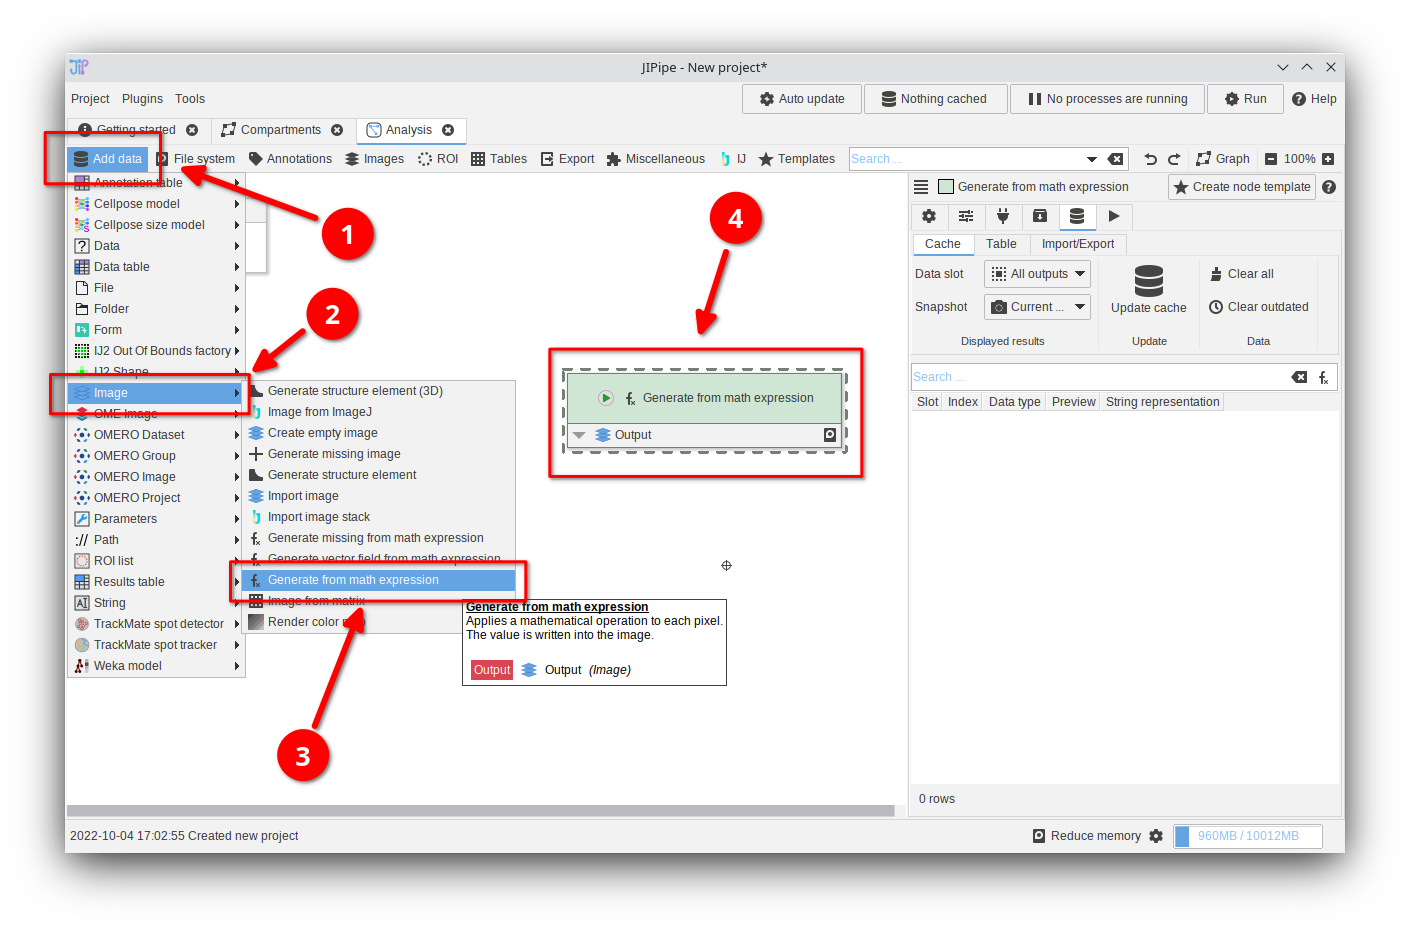
Step 1
In this tutorial we will work with a generated image, which is a quick and convenient way to test various features.
Begin by adding the node Add data > Image > Generate from math expression
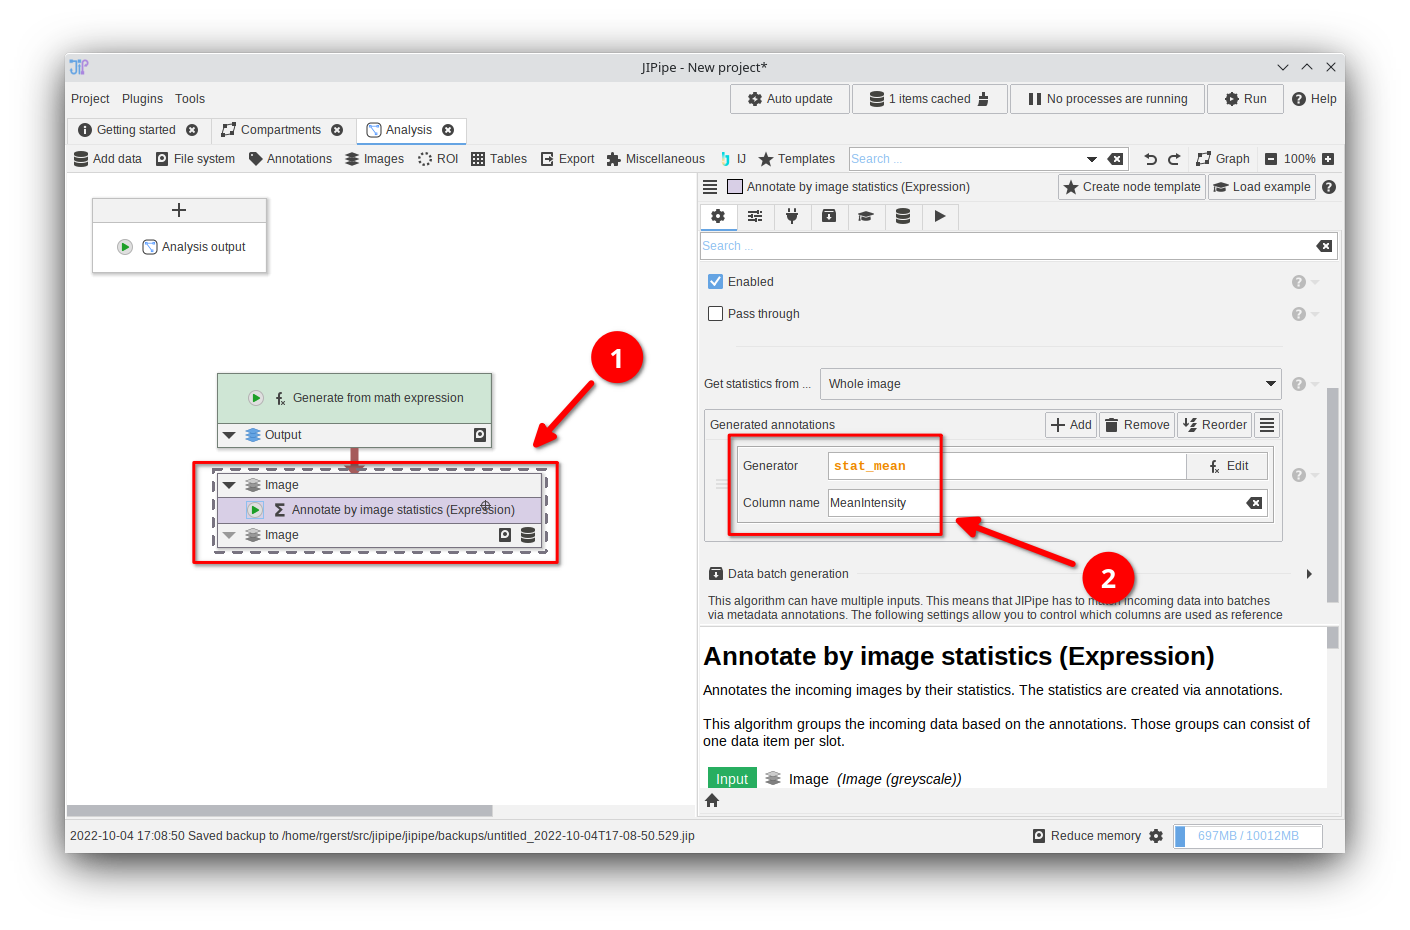
Step 2
Adding the node Annotate by image statistics (Expression) and configure the Generated annotations parameter in its parameter tab as following:
- Set
Generatortostat_mean(the mean intensity value; clickEditto find out more about variables) - Set
Column nametoMeanIntensity(the column name refers to the name of the generated annotation)
If you run the node via Update cache, you will see a new annotation MeanIntensity.
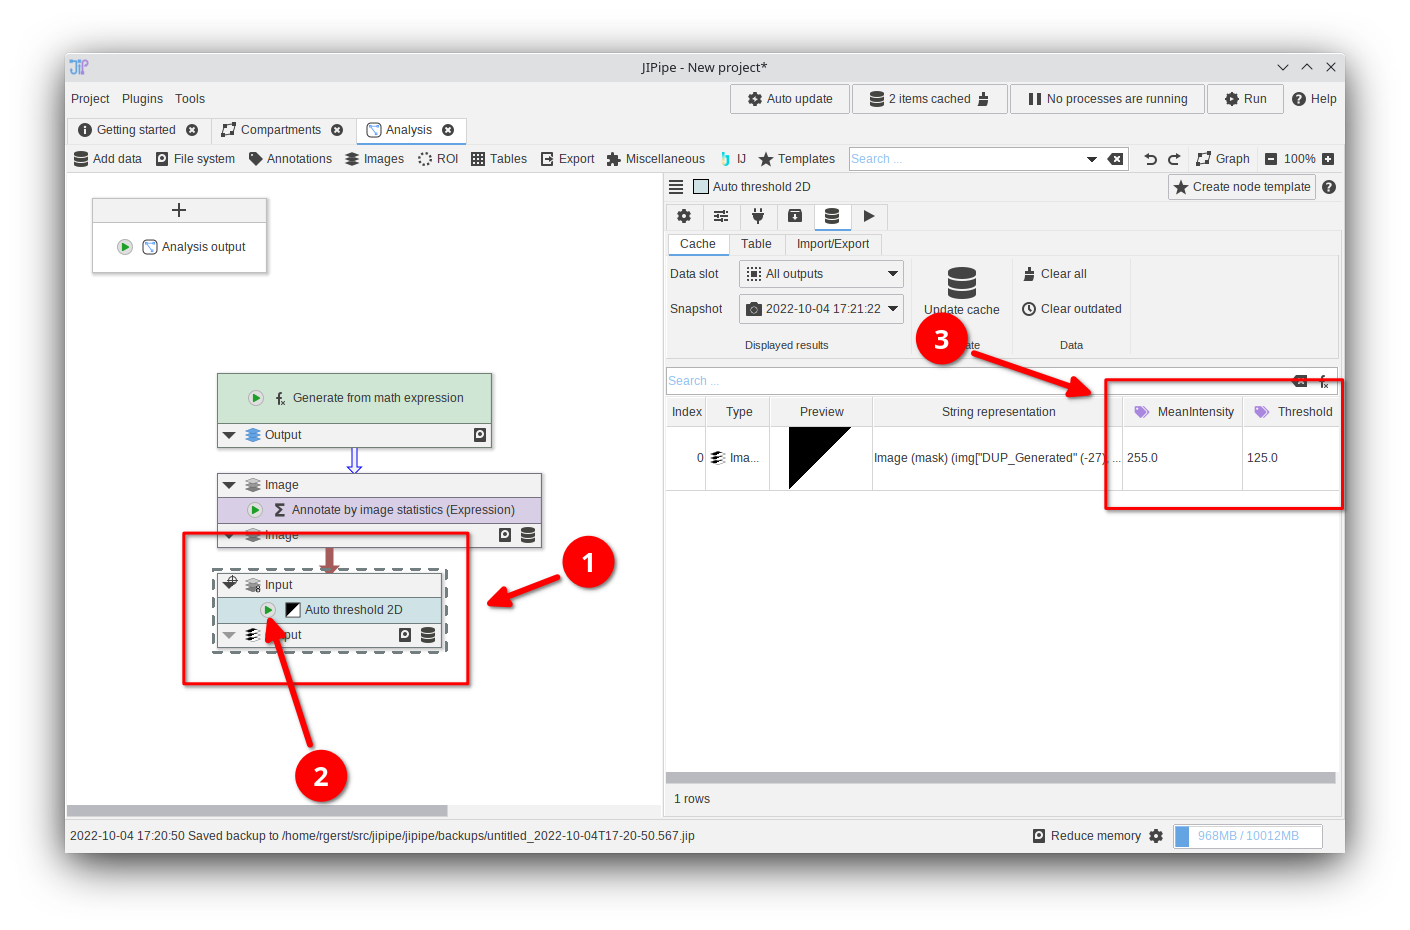
Step 3
Add an Auto threshold 2D node and run it with Update cache.
Observe that the set of annotations include both the calculated Threshold and the MeanIntensity value that was generated in the last step.
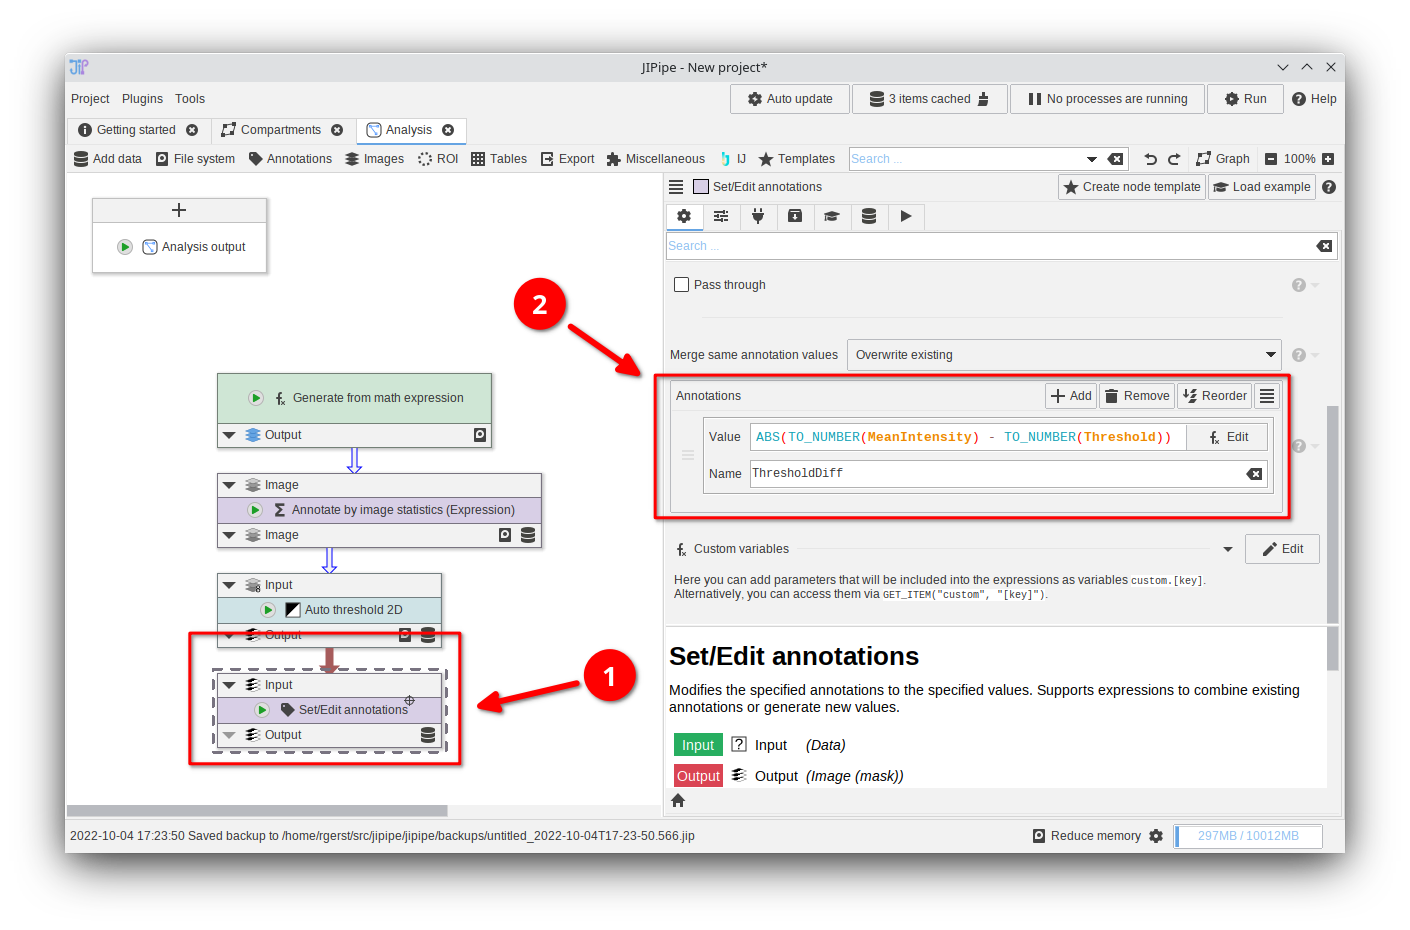
Step 4
Let’s calculate the difference between the threshold and the mean image intensity.
Add a node Set/Edit annotations and navigate to its Annotations parameter.
- Set the
ValuetoABS(TO_NUMBER(MeanIntensity) - TO_NUMBER(Threshold)) - Set the
NametoThresholdDiff
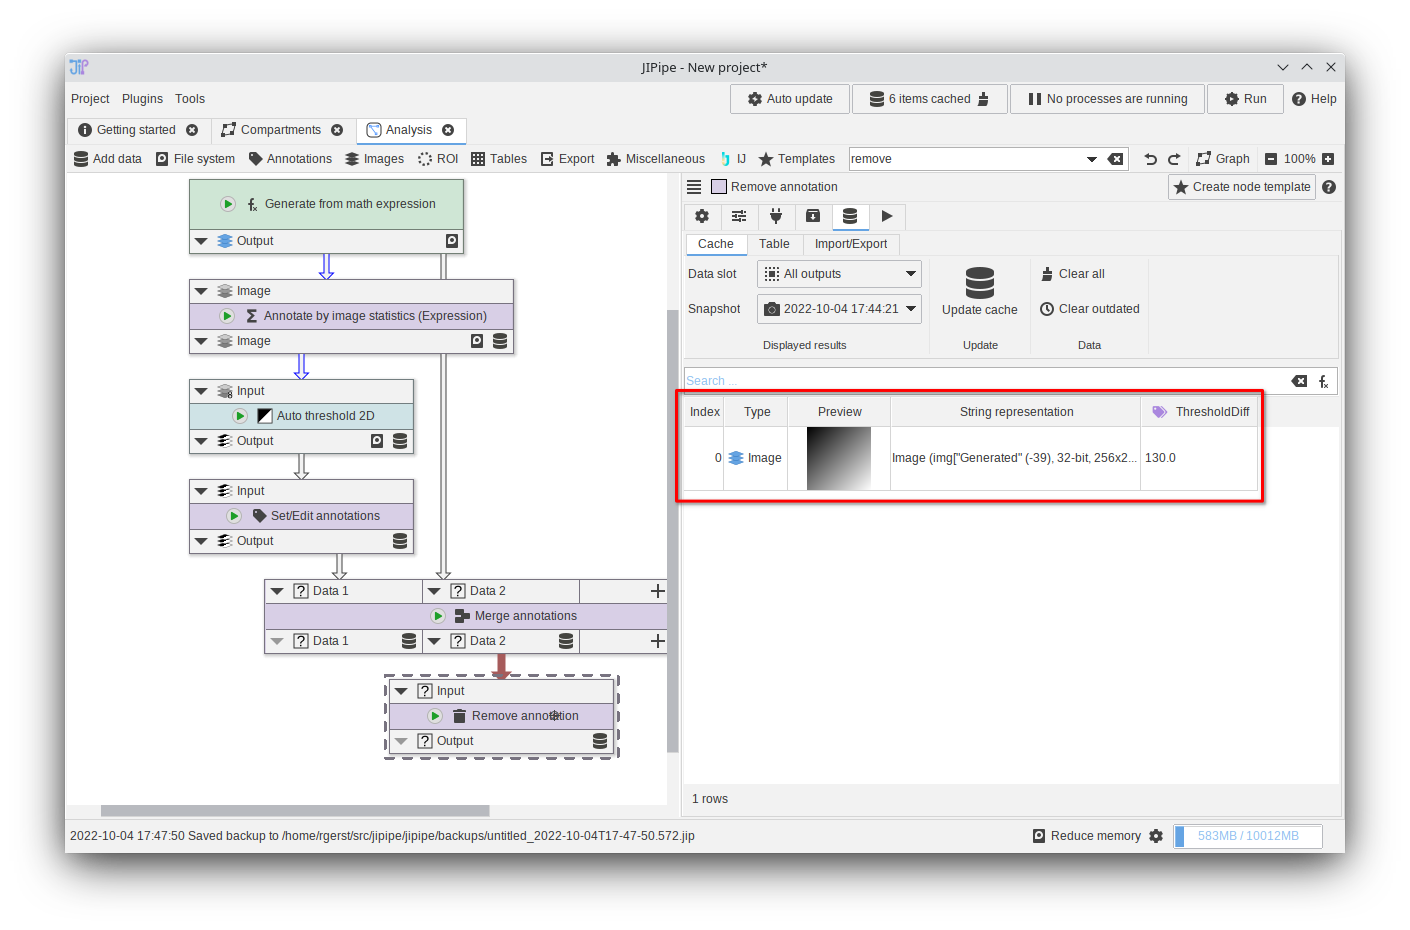
On running the node you should notice a new annotation ThresholdDiff that is set to the absolute difference between the threshold and mean image intensity.
Step 5
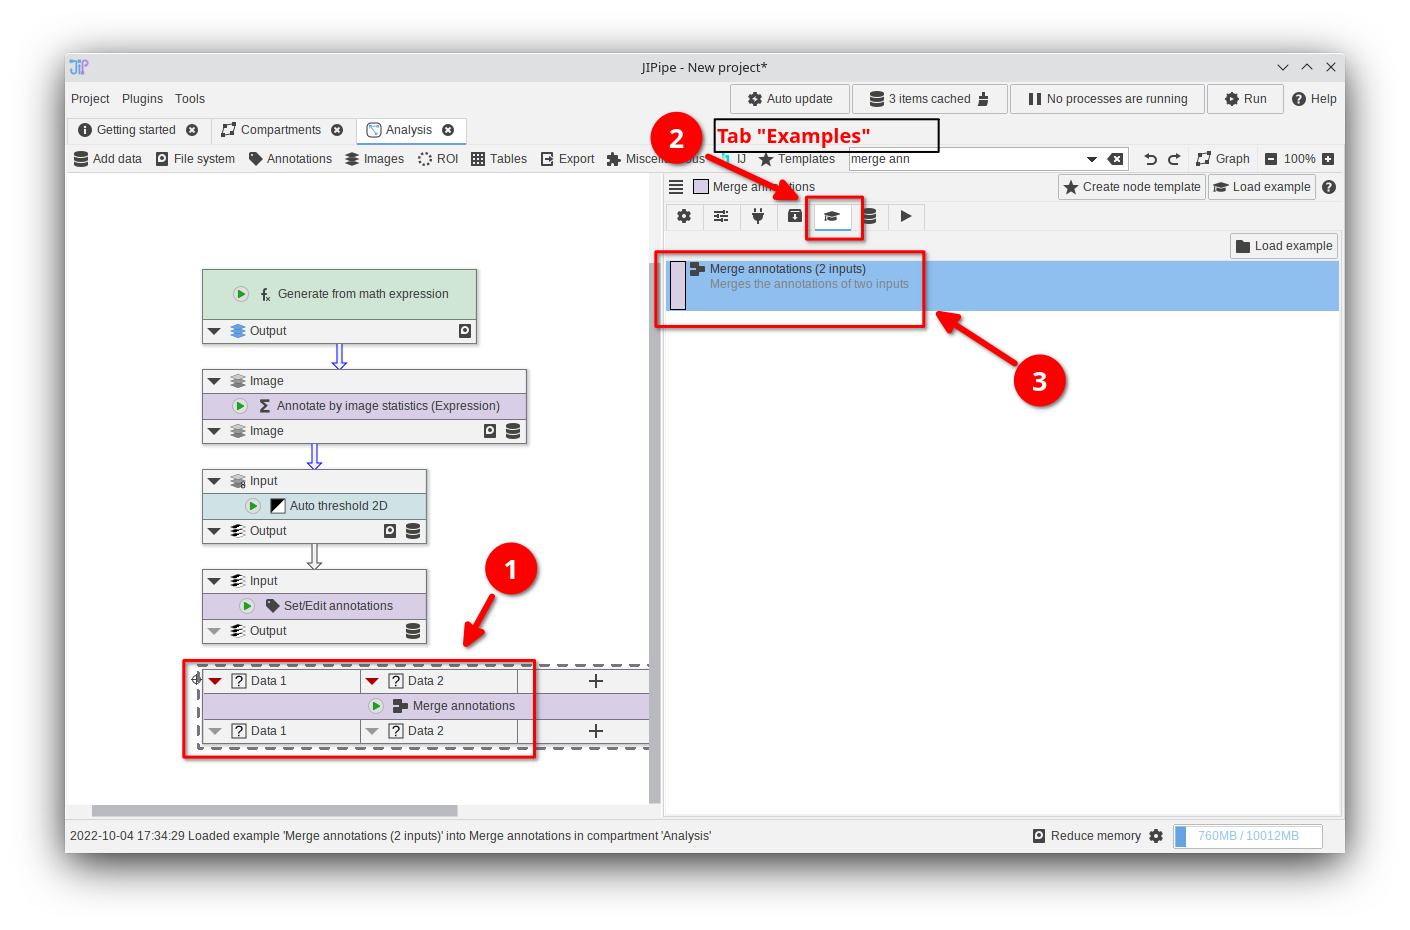
Let’s assume that we need the ThresholdDiff annotation in an earlier step (the raw image) or even completely different “branch” of processed data. JIPipe provides a node to copy annotations between two data sets: Merge annotations.
Begin by adding Merge annotations into the graph and navigate to the Examples tab. Here, load the example Merge annotations (2 inputs) for convenience. Alternatively, you can create the inputs yourself.
Step 6
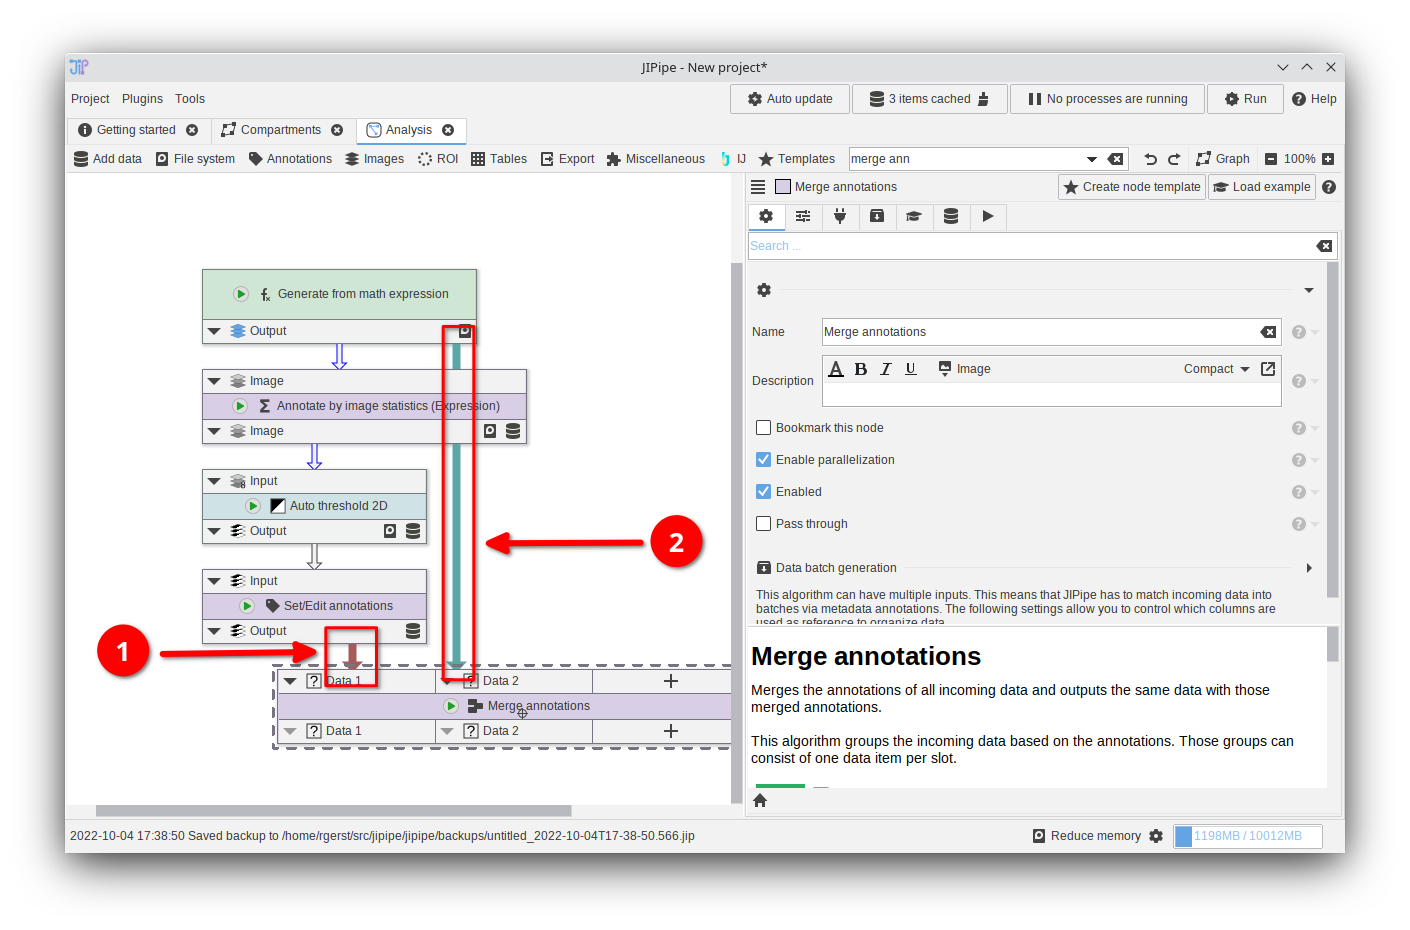
Connect the Set/Edit annotations output to one of the Merge annotations inputs, and the Generate from math expression output to the other.
Step 7
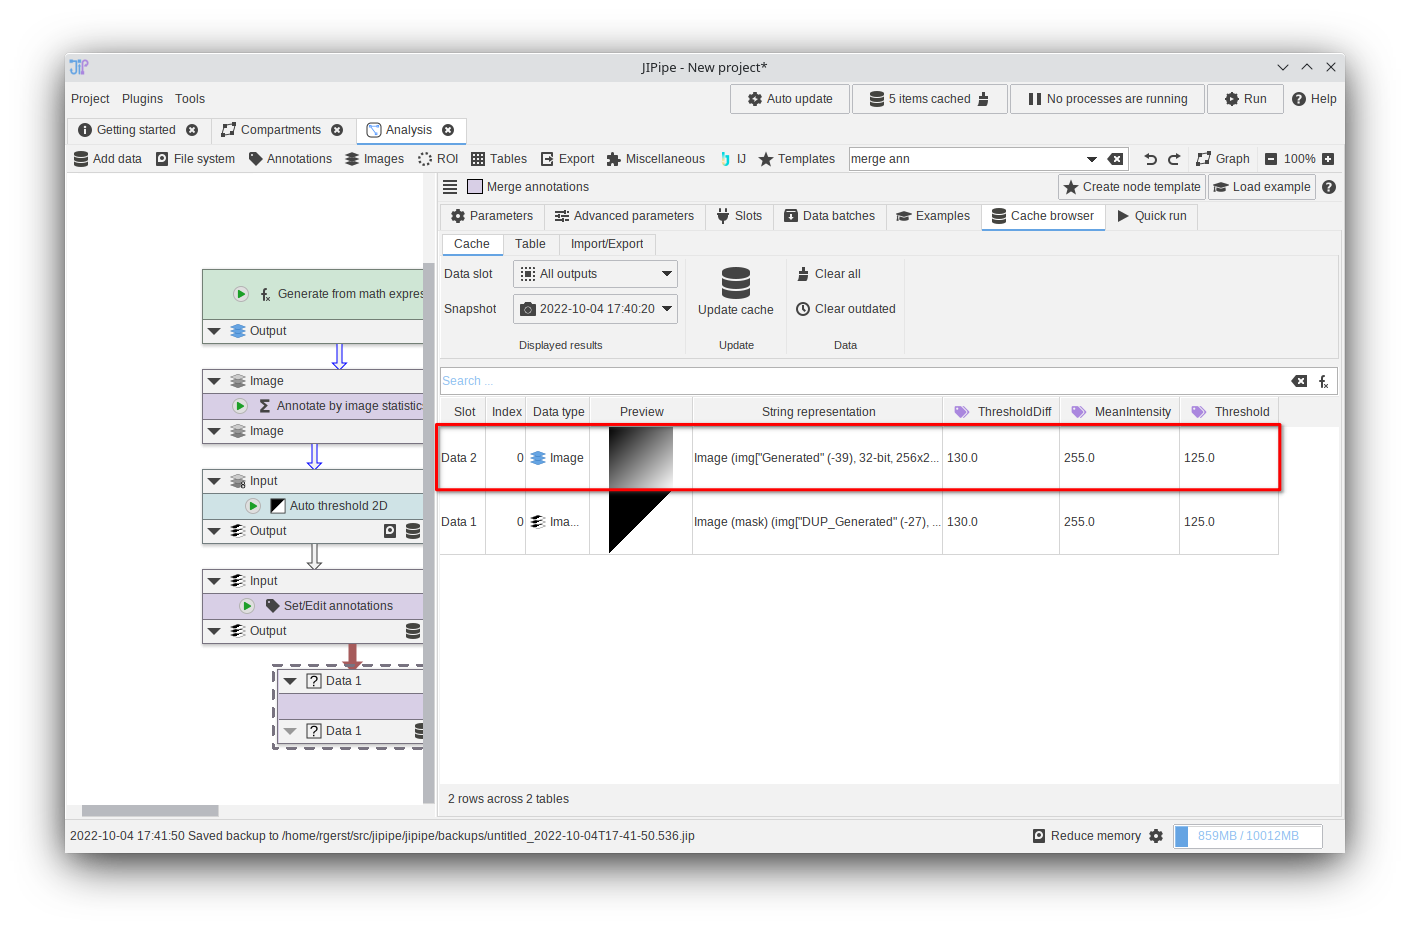
Run the Merge annotations node with Update cache and observe that the raw input image was annotated with information generated at a later step.
Step 8
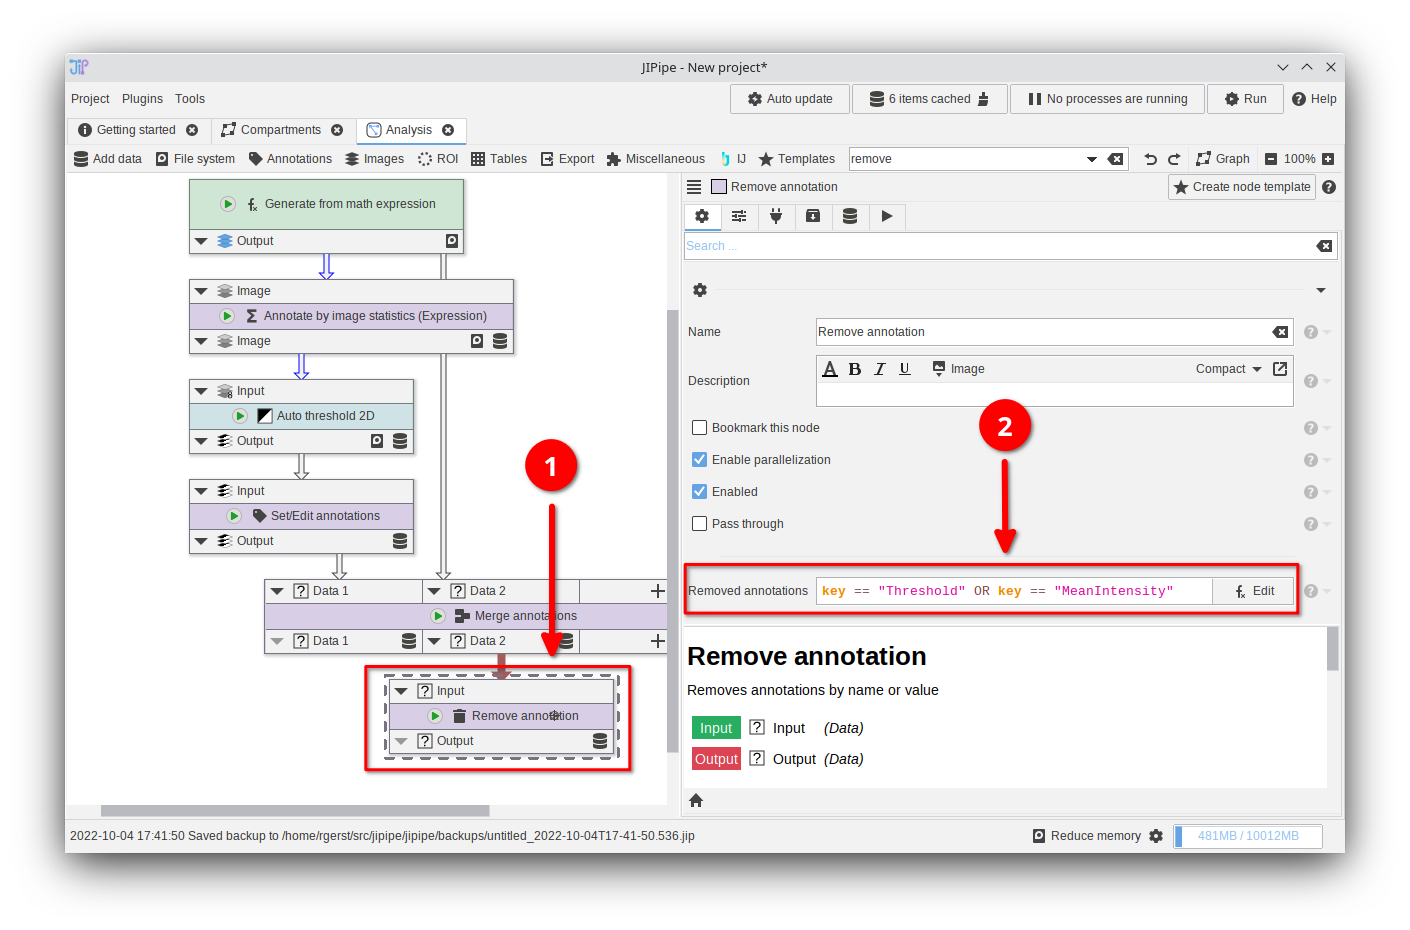
Now let’s assume that we do not need Threshold and MeanIntensity again. These can be removed via dedicated nodes.
Add a node Remove annotation and configure its Removed annotations parameter as following:
key == "Threshold" OR key == "MeanIntensity"This will remove all annotations that either have the name/key Threshold or MeanIntensity.
Step 9
Run the Remove annotation node with Update cache. The unwanted columns are now removed.