Overview
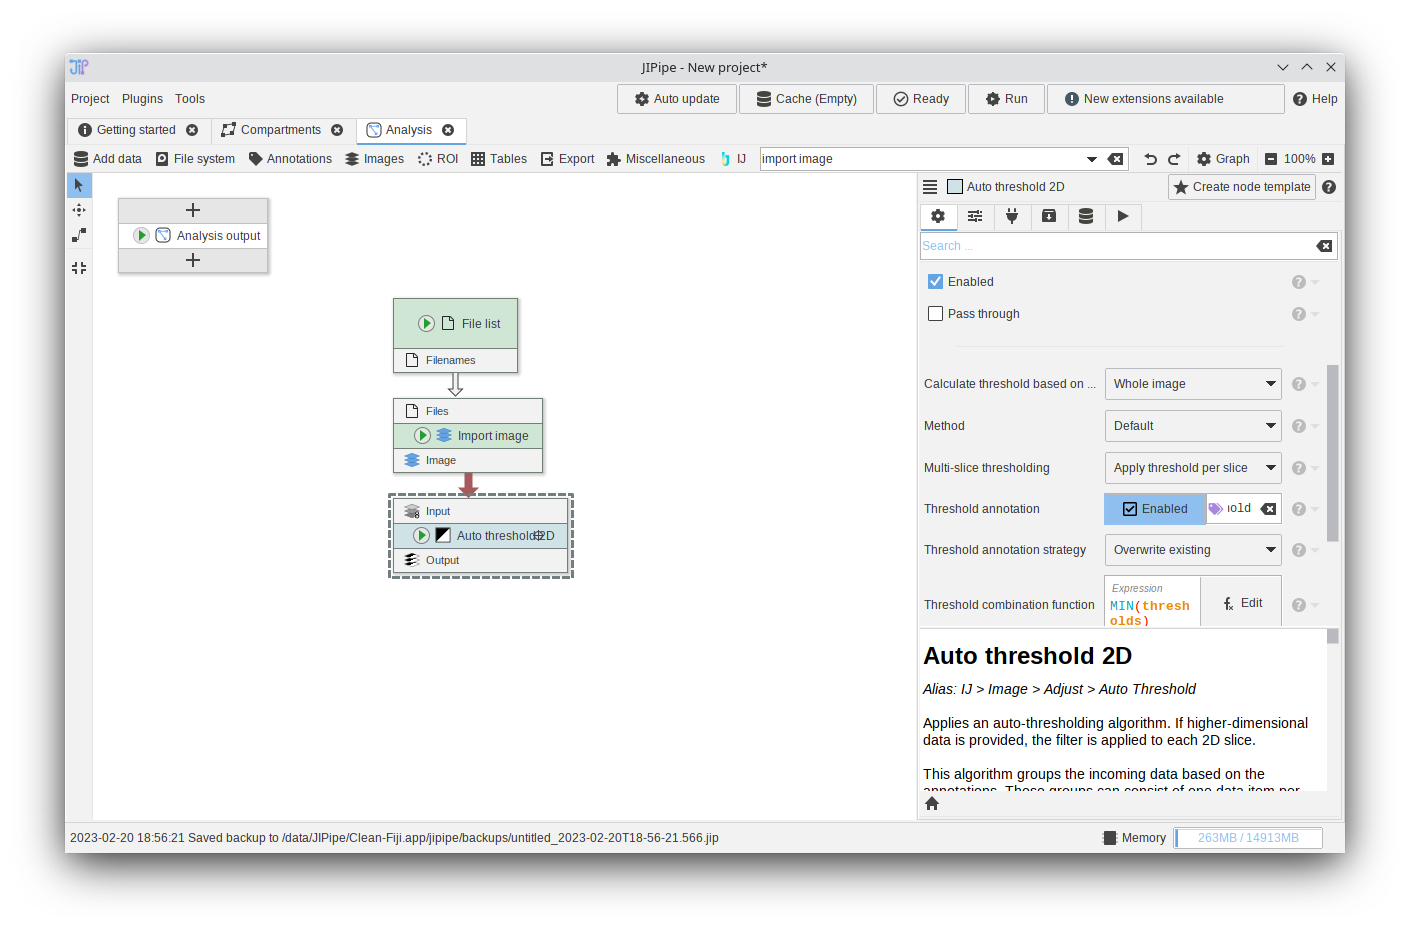
The pipeline editor is the main interface of JIPipe and allows you to create, edit, and run workflows. Usually it is located within a tab “Analysis” and is split into three different areas:
- The pipeline (or graph)
- The settings panel
- The menu bar
Adding nodes
JIPipe offers multiple options to add new nodes:
You can add nodes by browsing through the menu bar. Here we added “Create empty image” nodes from the “Add data > Image” menu.
You can also add nodes via the search bar.
All nodes can be found in a panel that is displayed if no node is selected. Here we added “Create empty image”.
JIPipe represents files and directories as nodes. You can either use the already presented methods to add the nodes or just drag your files/directories into JIPipe. The tool will then create and configure the nodes automatically.
You can easily extend an existing pipeline by opening the settings menu of an input or output slot and clicking “Find matching algorithm”. JIPipe then will provide a list of all compatible source/target nodes and add the selected one into the pipeline and connect it.
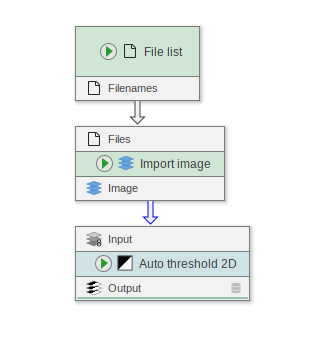
Connecting nodes
To form a pipeline, connect nodes to each other. You can do this either by drag & drop or by using the slot’s menu.
Drag a line from the source to the target slot. If you drag a line between already connected slots, they will be disconnected.
Click the gear icon of the slot to open its menu. Here you can make new connections or delete existing edges.
Zooming and panning
You can zoom and pan within the pipeline by using the following controls:
| Ctrl + Mouse wheel | Zoom in/out |
| Ctrl + Numpad-Plus | Zoom in |
| Ctrl + Numpad-Minus | Zoom out |
| Ctrl + Numpad-0 | Reset zoom (100%) |
| Zoom buttons (top right) | Zoom in/out, reset zoom, set zoom |
| Middle mouse button | Panning |
Pipeline editor modes
On the left-hand side of the pipeline are various buttons that change the behavior of the editor or provide useful tools.
The current tools are:
| No tool (default) | Move nodes and connect them into a pipeline | |
| Move nodes | Only move nodes. Connections cannot be accidentally modified | |
| Connect slots | Only make/delete connections. Nodes cannot be accidentally moved | |
| Center view to nodes | Removes large white spaces around your pipeline |
Changing node parameters
Many nodes have a variety of parameters that allow to change the behavior of the underlying operations.
To review and change the available settings, select a node by clicking it within the pipeline. The settings panel will change to display options that are related to the selected node. You can then change the settings as you see fit.
If you want to know more about the functionality of a parameter, click the (?) button next to the parameter.
Running a node
You can run any node by clicking the ![]() button. You will have the following options:
button. You will have the following options:
| Update cache | Runs the selected node and stores the results into a memory cache for review. |
| Cache intermediate results | Runs the selected node and stores its results and also the outputs of the predecessors into the cache. Please be careful with this option if the data is very large. |
| Run & show results | Runs the selected node and stores its results to the hard drive. Afterwards, a tab will open where you can review the results. |
| Show intermediate results | Runs the selected node and stores the results and also the outputs of the predecessors to the hard drive. Afterwards, a tab will open where you can review the results. |
| Update predecessor cache | Ensures that the predecessors (not the selected node) have outputs. This might be useful if you want to evaluate the behavior of parameters. |
| Clear cache | Clears the cached data of this node from the memory. |
Displaying results
If a node has cached outputs, it is indicated by a green line and an icon.
To display the list of available results, select the node and navigate to the ![]() Cache browser tab that will contain a table of all available results of the node. To show a result item, double-click it in the table.
Cache browser tab that will contain a table of all available results of the node. To show a result item, double-click it in the table.