Pipeline editor
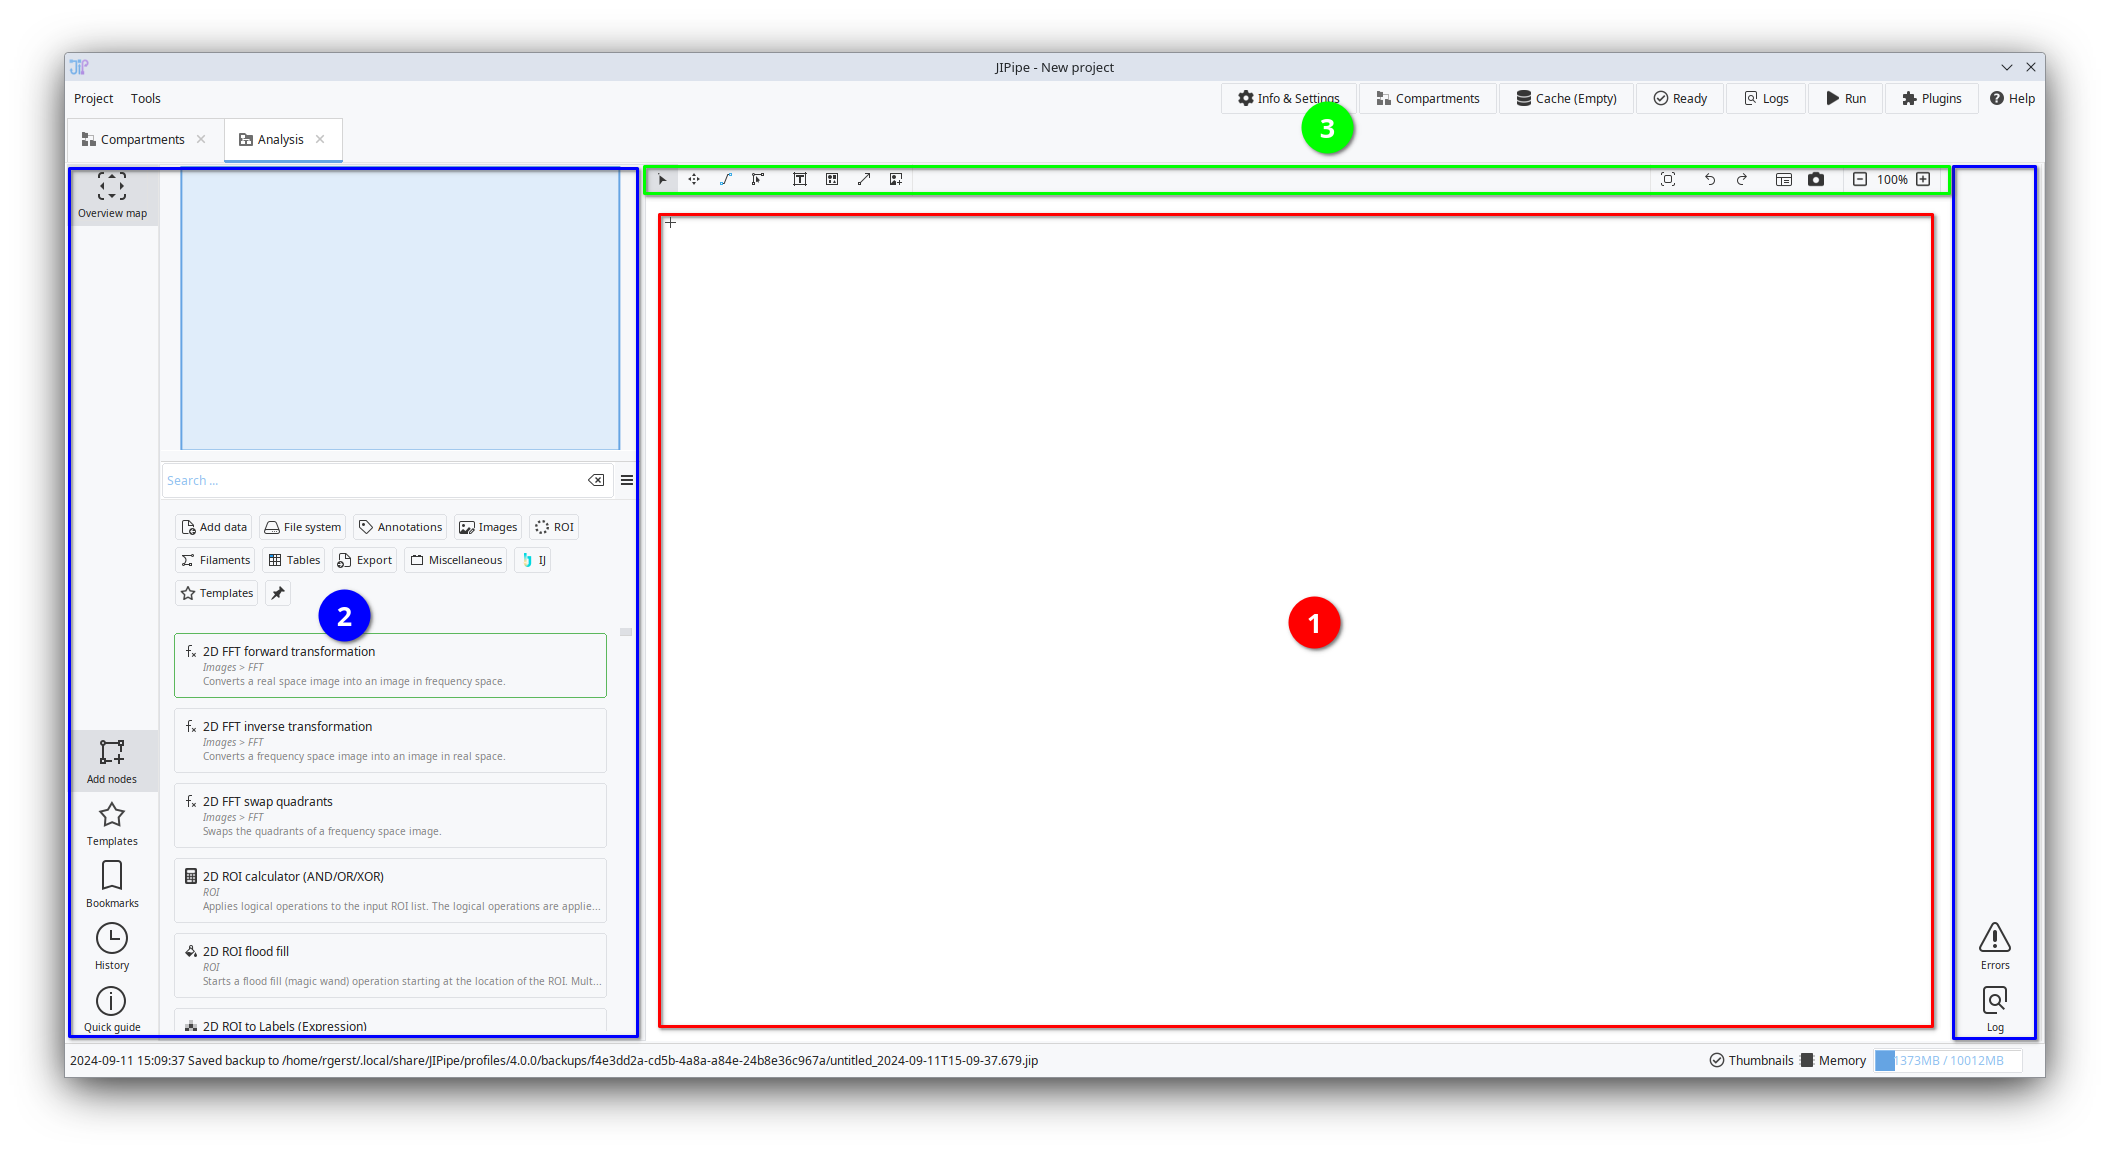
The pipeline/workflow editor is the central component of JIPipe, as it allows you to determine the processing steps and their order. The user interface can be divided in three main regions:
- ➊ Workflow
The (by default) empty white region is the space where you build a flow graph of the processing steps that should be applied.
- ➋ Sidebars
To the left and to the right are panels that can be opened and closed by clicking the associated button at the left/right side. The panels contain a variety of tools that are helpful in the process of creation and execution of workflows, as well as the review of results.
- ➌ Editing tools
Directly above the pipeline is a toolbar that contains a variety of editing-related tools, including:
Tools for only moving processing steps or directly modifying connections
Creation of text boxes and other annotations that help in the organization of pipelines
Common operations related to the current selection of nodes
Other tools like undo/redo, creation of screenshots, and zooming in and out
Workflow
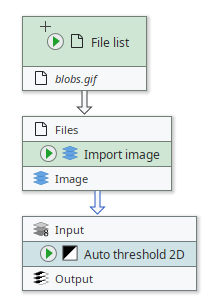
The workflow contains nodes that are connected into a pipeline.
Navigation
- Moving the view
For larger pipelines you can use the or the to move the view to a different section.
Alternatively, you can also 🖱 drag the view with the middle mouse button. As the available space is (theoretically) infinite, JIPipe will automatically enlarge the canvas based on your inputs.
- Resetting the view
If you accidentally got lost while navigating, you can click
 or press F12 to reset the view back to where the nodes are located.
 - Zooming
You can zoom into/out of the pipeline by ...
Holding Ctrl and 🖱 moving the mouse wheels,
Pressing Ctrl + Numpad+ (zoom in), Ctrl + Numpad- (zoom out), or Ctrl + Numpad0 (reset zoom to 100%),
or by using the zoom control

Node editing
- Moving nodes
Nodes can be moved by 🖱 dragging them by the colored (central) area or by selecting them with a 🖱 left click and moving them with the arrow keys ← ↑ → ↓.
- Selecting nodes
Nodes can be selected with a 🖱 left click or by 🖱 dragging a selection rectangle around them. You can also hold Shift and click/drag to add or remove nodes from the selection.
- Connecting nodes
Node inputs/outputs can be connected by 🖱 dragging a line between the input and output. It does not matter if the connection is started from the output or the input. We recommend to read more about this in the more comprehensive article.
- Disconnecting nodes
Node inputs/outputs can be disconnected by 🖱 dragging the connection between two already connected nodes again. We recommend to read more about this in the more comprehensive article.
Sidebars
The following overview will briefly explain the purpose of each side panel. Please note that panels marked with an * are not always shown.
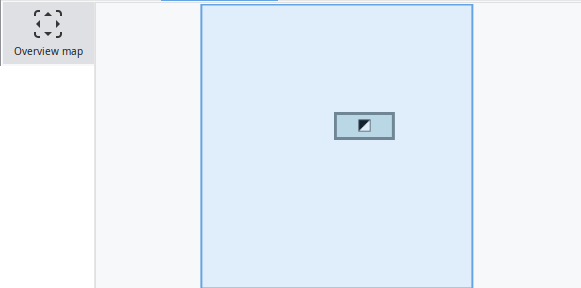
The map panel displays an overview of the whole pipeline. Nodes (processing steps) are shown as colored rectangles containing the node's representative icon. If a node is selected, it is highlighted with a thick outline.
The blue region represents the currently displayed area. You can move it around by 🖱 Dragging it while holding the left mouse button.
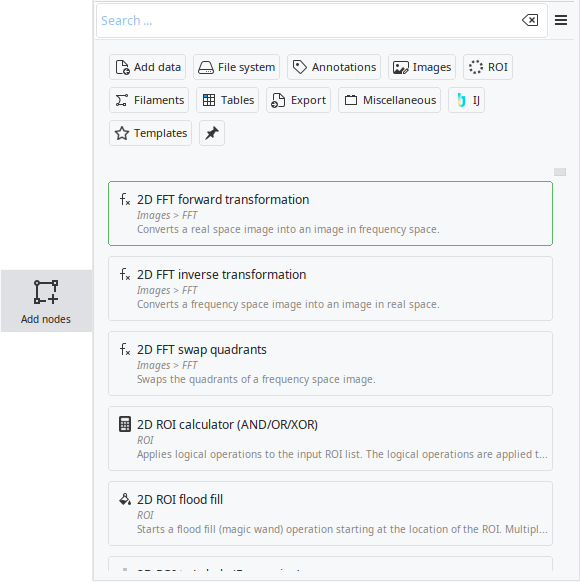
This panel is the main mode of adding new processing steps (nodes) into the workflow. It is structured into a search bar, a list of category filters, and the list of nodes that match the search/filters.
Nodes can be added into the workflow by either 🖱 dragging them out of the list into the workflow, by 🖱 double-clicking them, or by pressing Enter when an item is highlighted in green.
To learn more about the Add nodes panel, please take a look at our more comprehensive documentation.
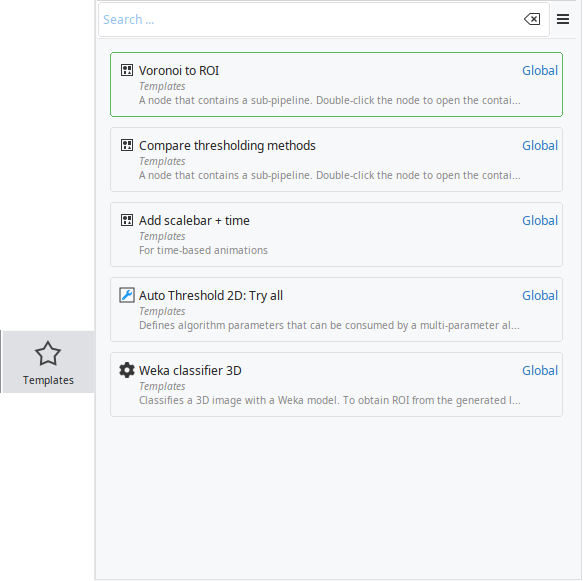
Contains a customizable list of re-usable pipeline parts to speed up the creation of workflows. Please visit the node templates page to learn more about this feature.
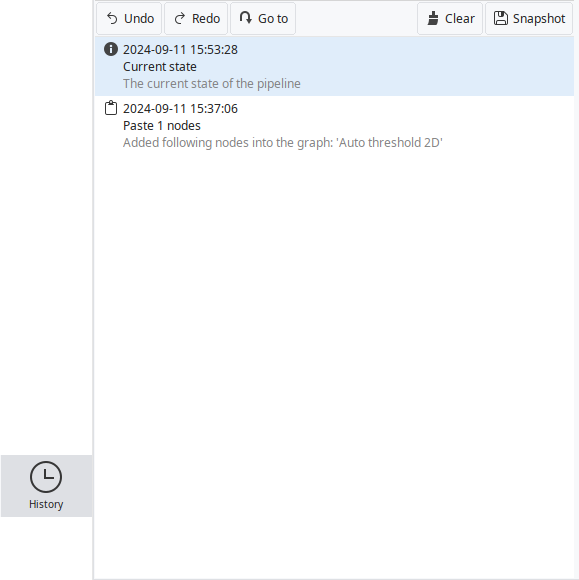
Tracks the list of editing operations that were applied. This panel is directly connected to the undo Ctrl + Z and redo Ctrl + Shift + Z features that allow you to undo mistakes while editing the workflow.
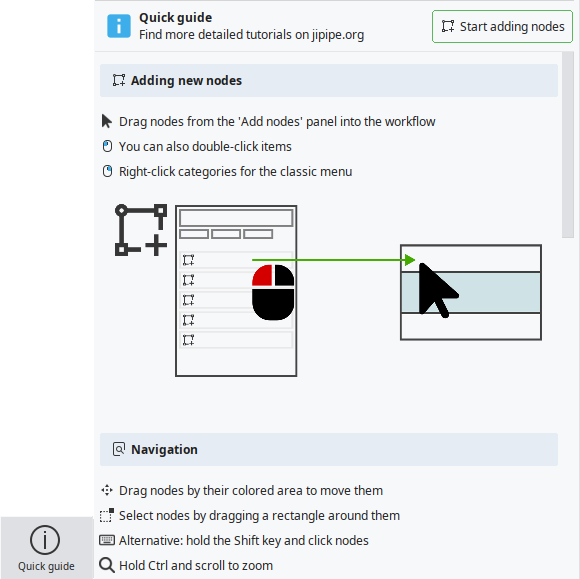
This panel is shown at the first start of JIPipe and briefly explains how to do basic operations. The Start adding nodes button will open the Add nodes panel.
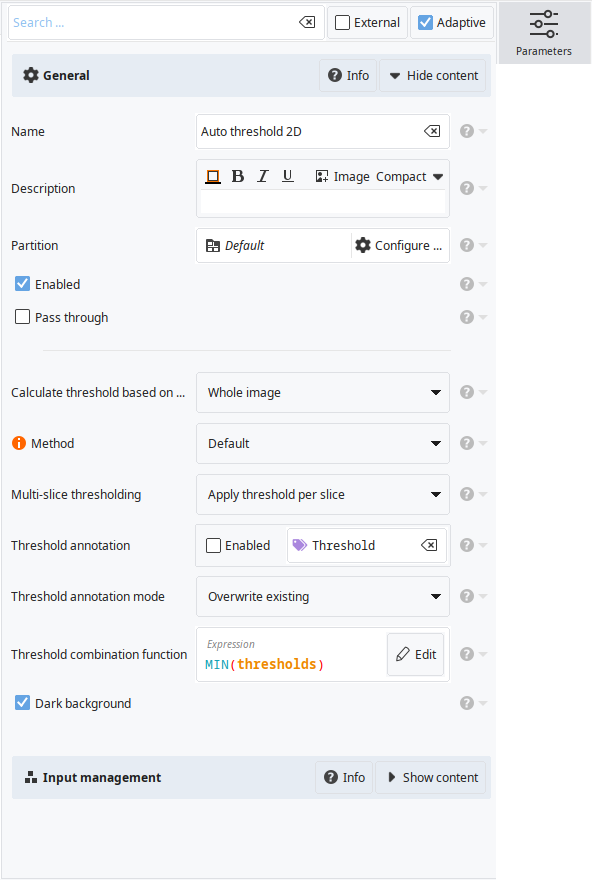
Only shown if exactly one node is selected.
All parameters/settings of the selected node are displayed in the Parameters panel. Use it to review and modify the behavior of the selected node.
To learn more about how to edit parameters and advanced features of the panel, please take a look at our more comprehensive documentation.
Only shown if exactly one node is selected.
The Slots panel contains a list of all inputs and outputs of a node. The panel also allows to edit and reorder slots.
To learn more about how to control the inputs and outputs of a node, please take a look at our more comprehensive documentation.
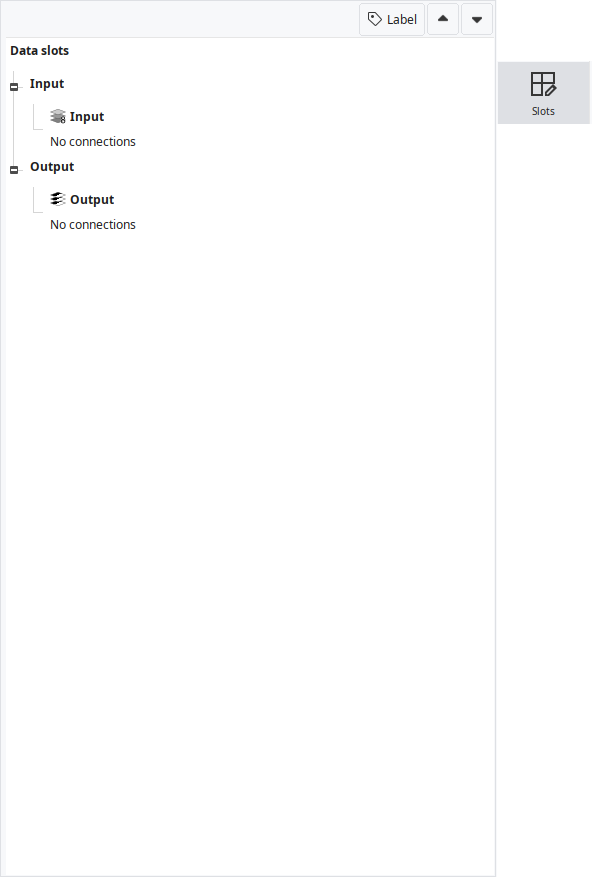
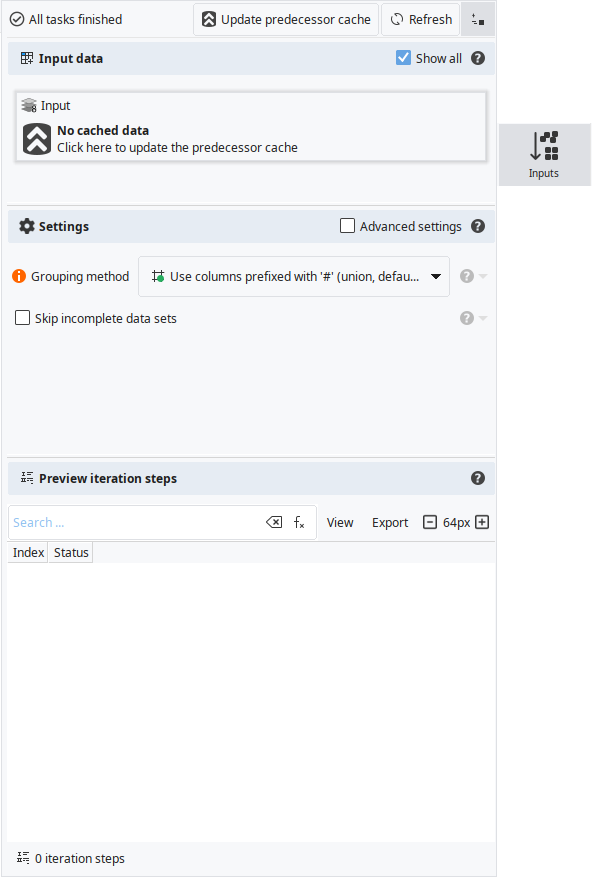
Only shown if exactly one node that supports input management is selected.
The Inputs panel allows to review and control the behavior of JIPipe's batch processing system. It showcases which data is processed together in an iteration step, making the feature a powerful tool to debug issues or achieve advanced data processing.
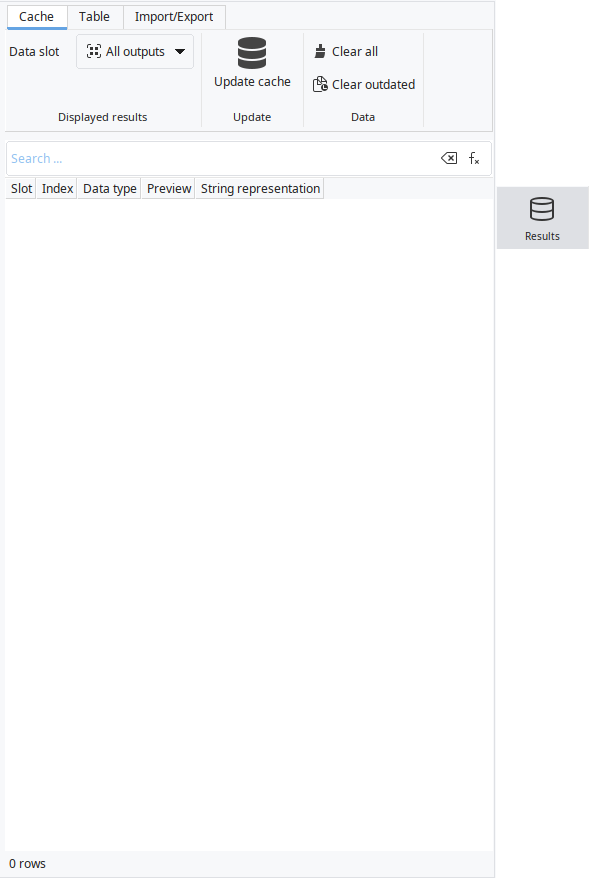
Only shown if exactly one node that produces results is selected.
Results that are generated by the node via an / run can be accessed via the Results panel.
To learn more about how to generate and browse results, please take a look at our more comprehensive documentation.
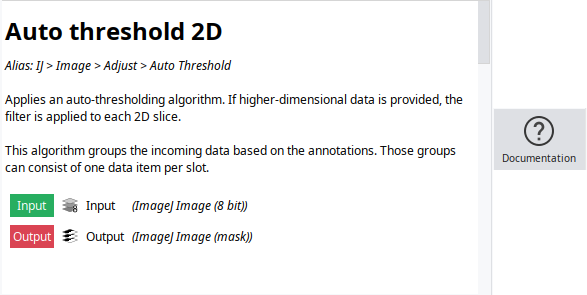
Only shown if exactly one node is selected. May also be opened by other actions.
Displays the documentation of the currently selected node (or other supported item).
Displays the latest error messages if any were produced.
If a process is running, displays the current status of the operation.
Editing tools

The toolbar displayed above the pipeline editor contains the following commands:
❶ Node tools
The first tool category involves operations that are related to moving and connecting nodes.
- Default tool
 or Esc or 🖱 Right-click
The default tool that allows you to edit nodes and connections
- Move tool
 or F1
or F1Tool that only allows you to move nodes. You will not be able to accidentally modify connections.
- Connection editor tool
 or F2
or F2Tool that only allows you to add/remove connections. You will not be able to accidentally move nodes.
- Rewire tool
 or F3
or F3"Grabs" all connections from an input or output and moves the connections to another input/output, similar to if you unplug a power plug and put it into another socket.
❷ Graph annotation tools
The second category involves tools for creating graph annotations (e.g. text boxes) that are useful for annotating the pipeline.
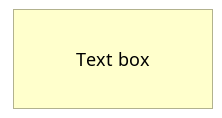
- Text box
 or F4
or F4🖱 Drag an area with your mouse and insert a text message to create a text box.
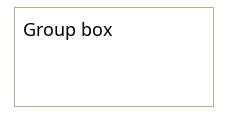
- Group box
 or F5
or F5🖱 Drag an area with your mouse and insert a text message to create a text box that has a white background and where the text is located at the top left.
- Arrow
 or F5
or F5🖱 Drag to create an arrow.
- Image
 or F6
or F6🖱 Drag an area with your mouse and provide an image file (PNG/BMP/JPG) to insert it into the pipeline.
❸ Context-based commands
After the graph annotation tools, the toolbar displays actions that are based on the current selection of nodes. This means that none are displayed if you did not select a node.
❹ Additional commands
Finally, the toolbar contains a variety of additional useful commands.
- Center view to nodes
 or F12
Resets the zoom and centers the view back to your nodes. This function will also remove large empty spaces around the bounds of all your nodes.
- Undo
 or Ctrl + Z
Reverts the last change made to the pipeline. Can be executed multiple times (up to 50 by default).
- Redo
 or Ctrl + Shift + Z
Restores a change that was undone by .
- Layout menu

Opens a menu with a variety of layout (pipeline and UI) options.
- Snapshot menu

Opens a menu with operations that allow you to create screenshots of the graph and export them to PNG/SVG/Clipboard.
- Zoom controls
 or Ctrl + Numpad+ or Ctrl + Numpad- or Ctrl + Numpad0 or Ctrl + 🖱 Mouse wheel up/down
Allows to zoom into/out of the pipeline. You can also use the mouse wheel and keyboard shortcuts to modify the zoom.