Annotating data with measurements
Explains how to annotate data with measurements for the usage in more advanced pipelines with filters and adaptive pipelines
Tutorial: Annotating data with measurements
Step 1
Open the example tutorial project.
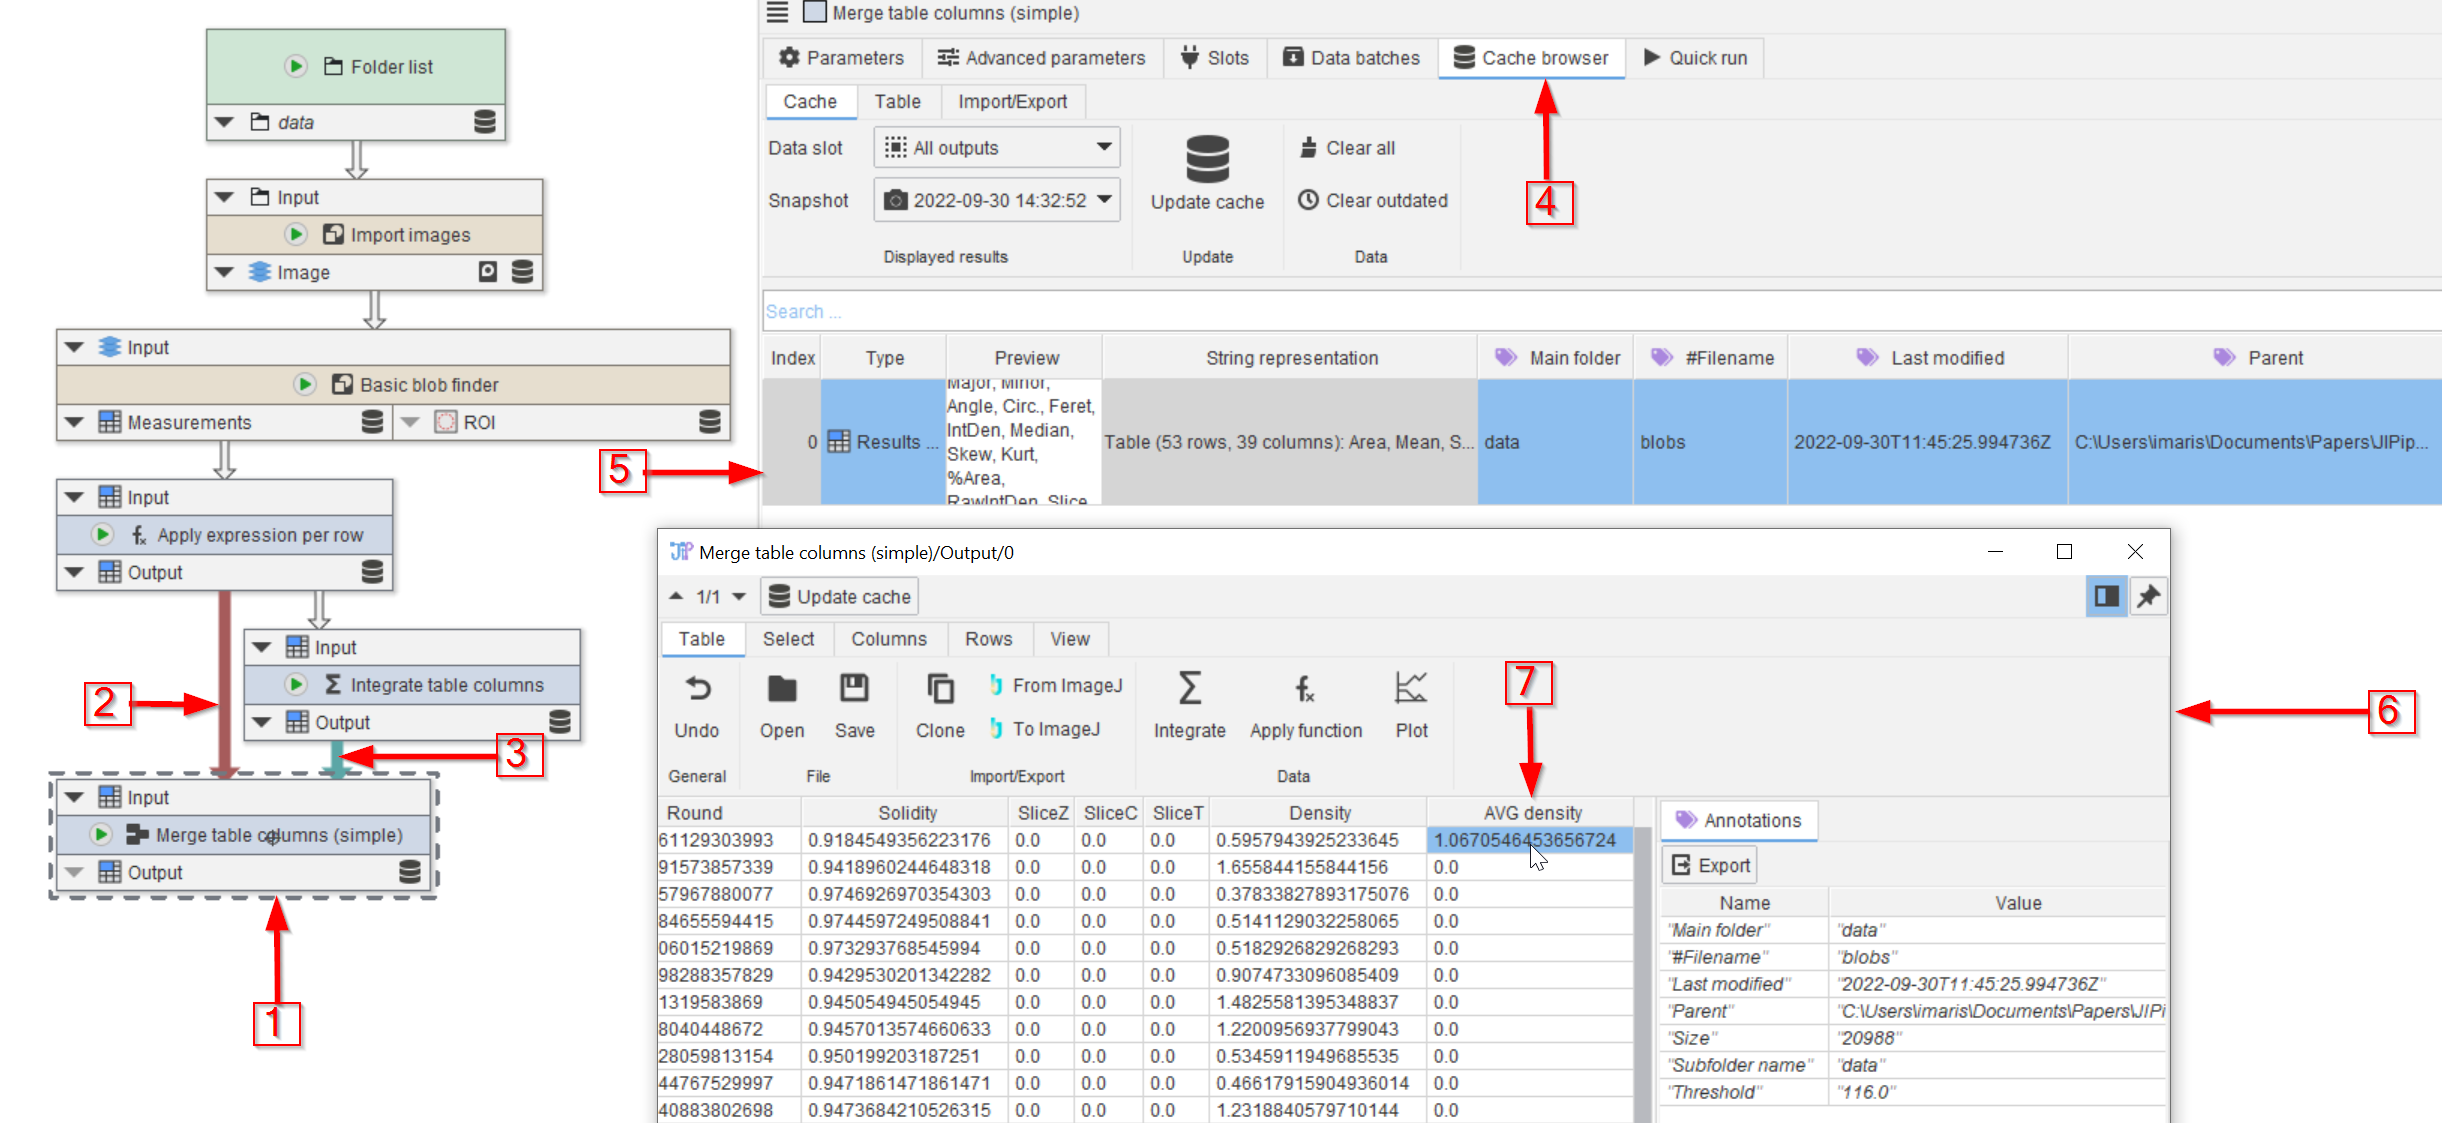
Add the Merge table columns (simple) node (red arrow 1) and connect it to the two nodes above (red arrow 2, 3).
Run the node and in its cache browser (red arrow 4) open the cache entry (red arrow 5) in a viewer (red arrow 6).
Scroll to the end of the table and observe that the AVG Density column now appears in the table (red arrow 7)
Merge table columns (simple) merges the column set of all incoming tables, generating a table that has all information of the input tables.
Merge table columns (simple) is not required to annotate data with measurements, but it produces a singular table with all information.
You might have noticed that all AVG Density values except the first one are zero in the merged table. You can change this behavior by setting the Row normalization parameter of the node to Last value.
Step 2
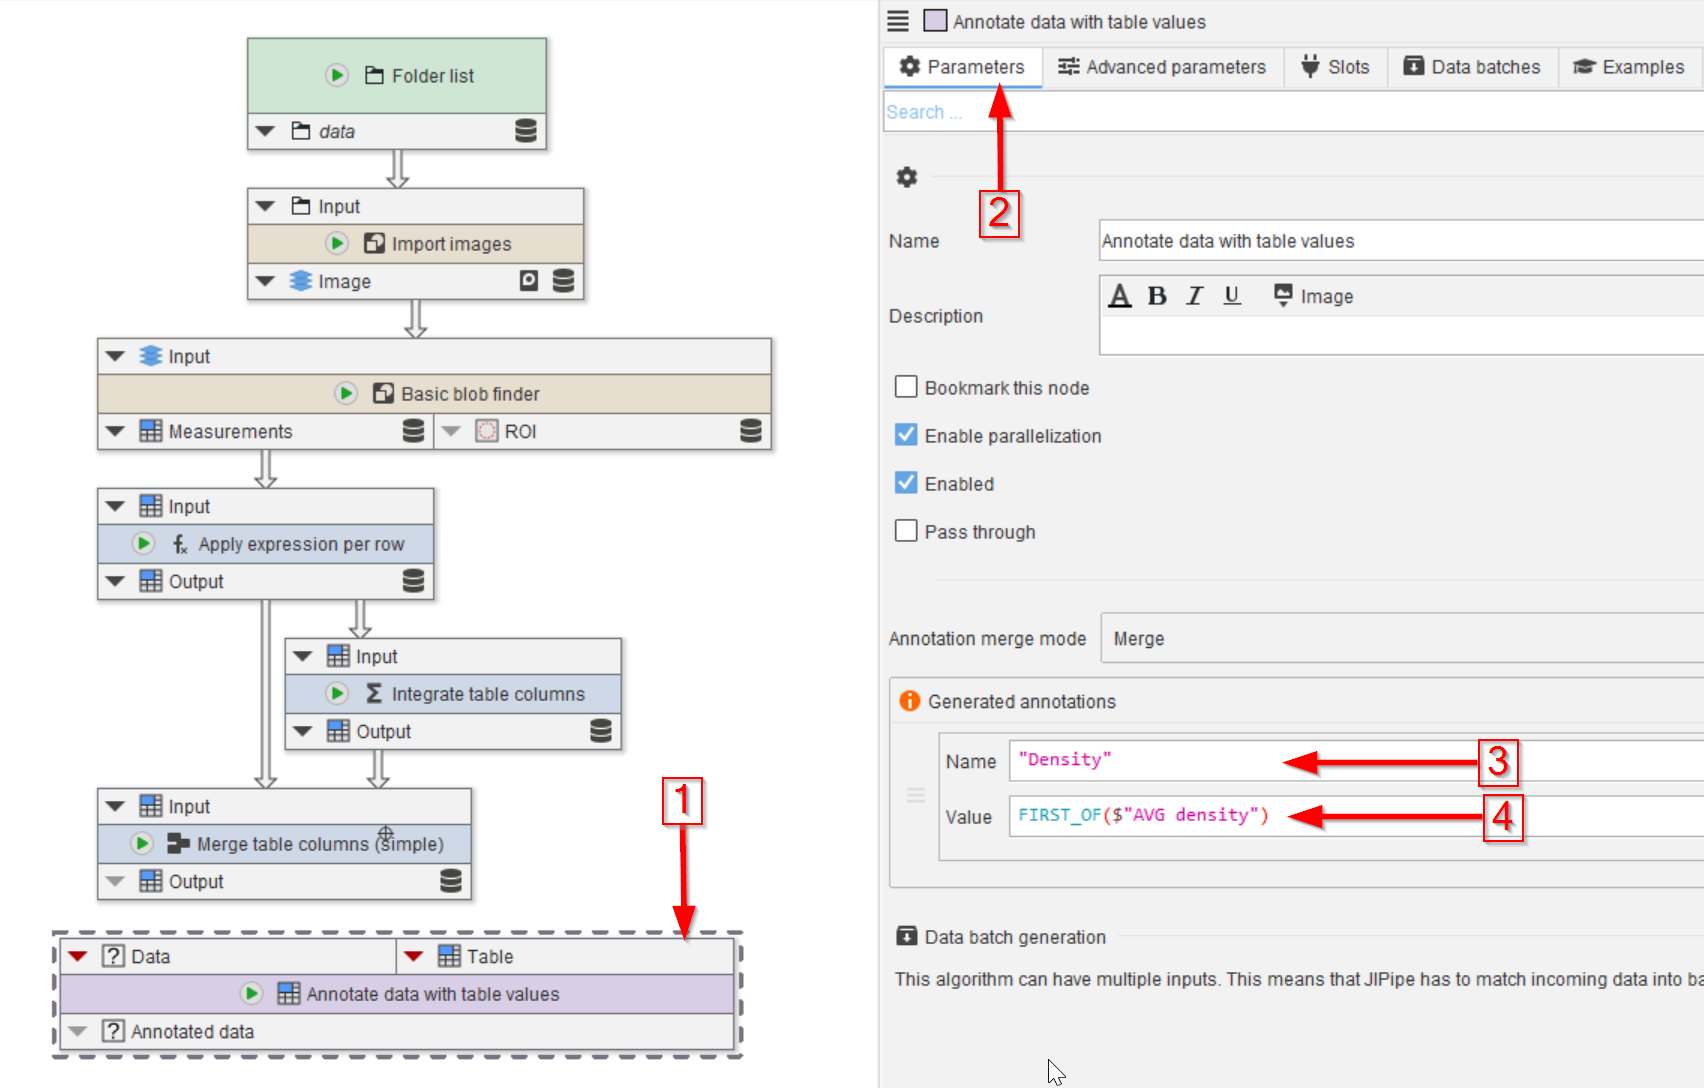
Add the node Annotate data with table values to the UI (red arrow 1).
In the Parameters tab (red arrow 2) add the average density as an image annotation (red arrows 3 and 4).
Each annotation consists of two parts:
- The
Nameis the name of the annotation. Set it to"Density". Please note that this is an expression (as the text is colored) and text should be put into quotes. - The
Valuesetting generates the annotation value. It has access to all incoming annotations and variables that contain all values of each table column. Set it to `FIRST_OF($“AVG density”)
The Value setting is provided with access to the annotations of the data (for example you can access the #Filename annotation), as well as variables that contain all values of the column with the same name.
In our case, we have a input table column AVG density. The AVG density variable inside the expression will be a list that contains all the AVG density values:
AVG density = [ 1.06705, 0, 0, 0, 0, ... ]
All other columns will also be available:
Solidity = [ 0.91845, 0.94189, 0.97469, ... ]
SliceZ = [ 0, 0, 0, ...]
SliceC = [ 0, 0, 0, ...]
...
If we type in AVG density into the expression, it fails because of the space character. This is why the variable is accessed via $"AVG density", which is a special operator designed to handle such issues.
The valid expression then would be
$"AVG density"
This will create an annotation with the name Density and the value [ 1.06705, 0, 0, 0, 0, ... ], as there are multiple values in a column. To only access the first of these items, we used FIRST_OF:
FIRST_OF($"AVG density")
Depending on your project, you might want other integration functions, e.g., SUM($"AVG density"), MEAN($"AVG density"), or access the second number via GET_ITEM($"AVG density", 1).
Step 3
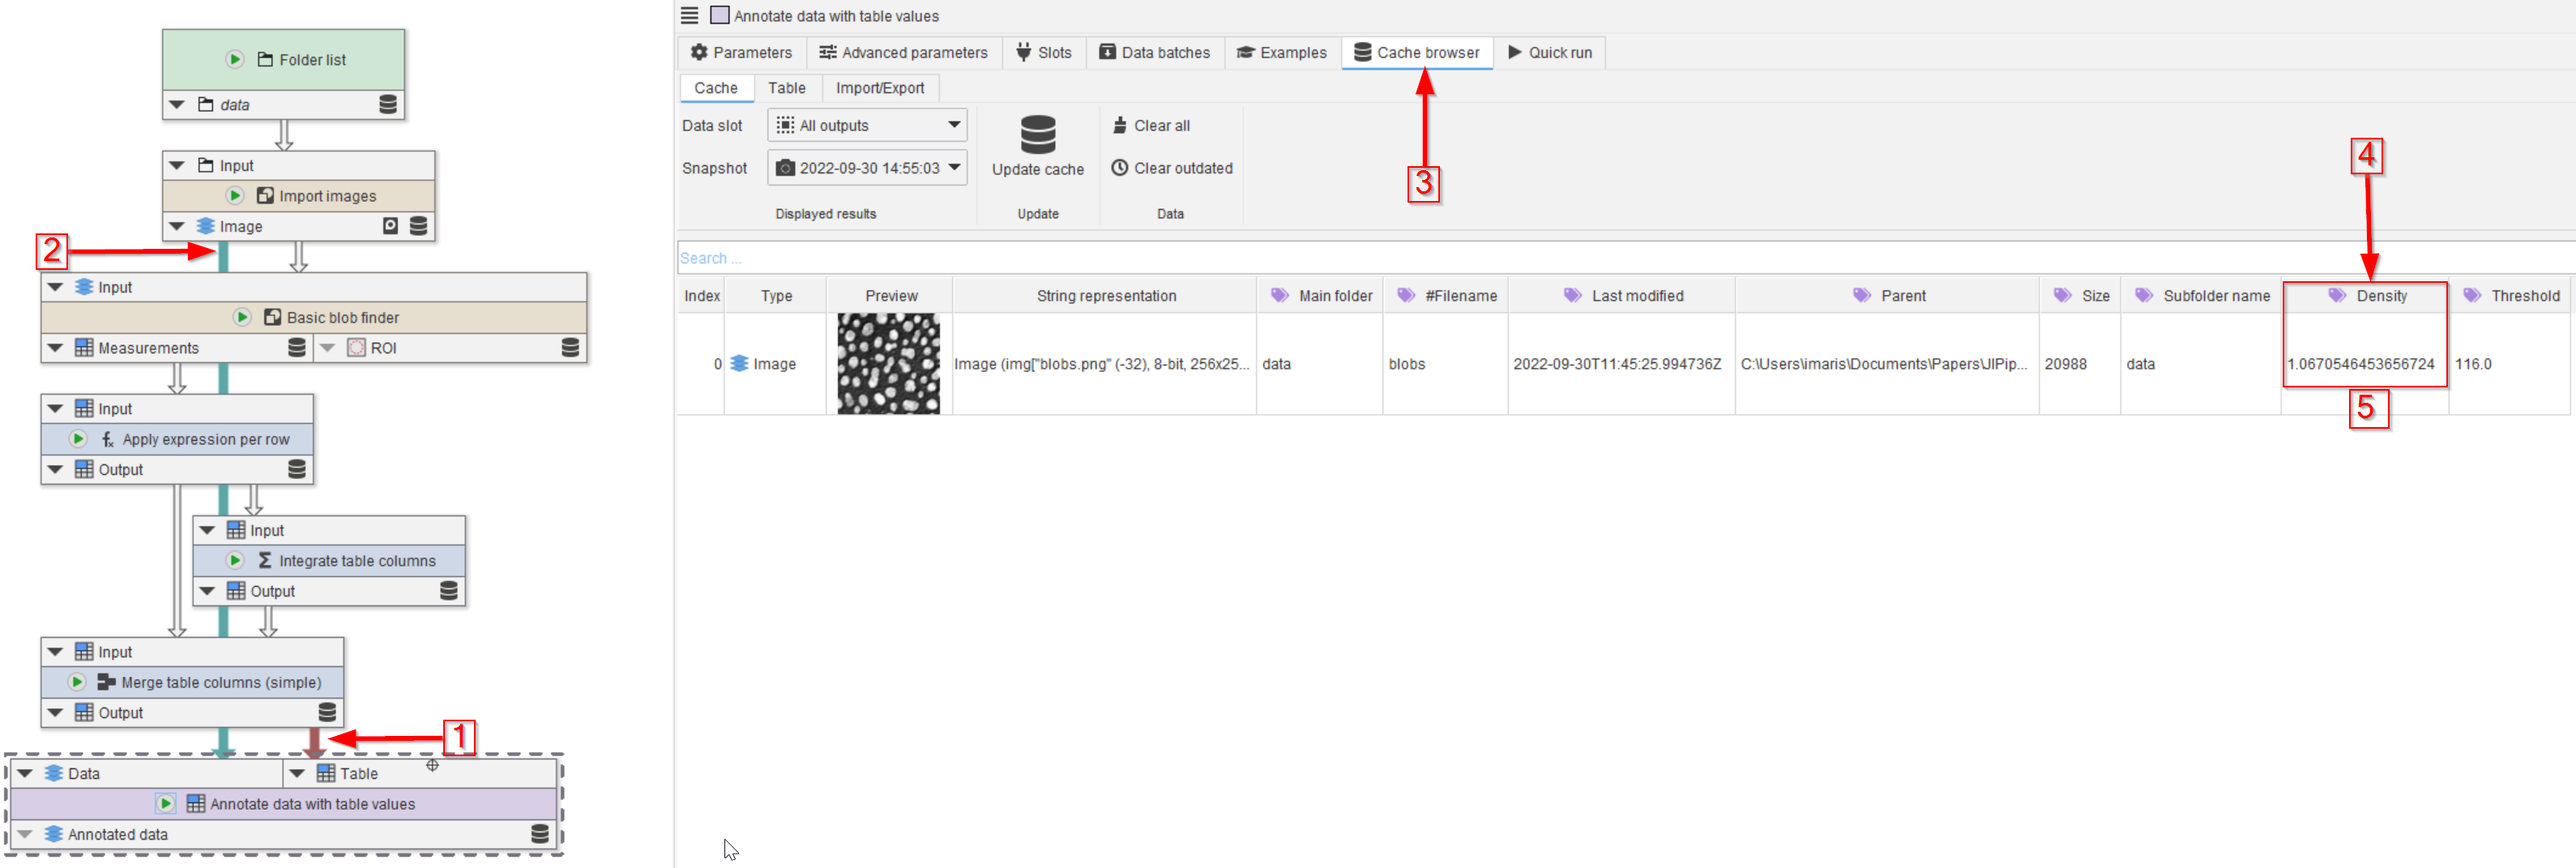
Connect the node to the merged table (red arrow 1) and to the image (red arrow 2).
Run the node and observe the Cache browser (red arrow 3). The average density now appears as a new annotation (red arrow 4, red rectangle 5).