Visual programming
JIPipe is a visual programming language, meaning that it allows you to program your advanced own image/data analysis workflows, but without involving any (or only minimal in certain cases) writing of text-based scripts. The main goal is to allow everyone to create reproducible workflows, even if they are not a programmer.
From ImageJ to visual flow charts
JIPipe is based on the popular image analysis tool ImageJ and inherits a large variety of its functions from this software and related plugins.
ImageJ is a very user-friendly GUI that gives users access to image processing via menus.

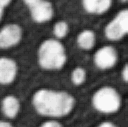
For example, to count particles in an image, one would apply the following operations:

and select the image, which will open the image as window
, insert the value
3, and press OK, set the value to
Otsu, and press Apply, enable Display results and Add to Manager, and press OK
Reproducing such a procedure for hundreds of images is error-prone and cumbersome. This is why ImageJ comes with a macro programming feature that allows you to record the applied operations and convert them into a script:
The code produced by the recorder is not 100% perfect and requires further additions like a for loop to make it suitable for automated batch processing. It is also not very accessible to non-programmers and cannot be easily extended or modified without learning the syntax of the macro language.
One additional issue with code is that it is hard to read and to explain, for example in the environment of a publication or conference presentation/poster. A suitable alternative to displaying the code as-is is to create a flow chart:
The idea behind a visual programming language is to skip the writing of the script and instead just design the flow-chart. Software like JIPipe then applies all necessary processing steps in the background.
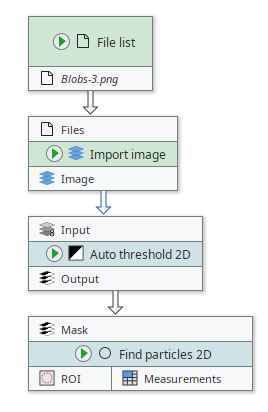
The equivalent workflow in JIPipe would look as following:

Nodes in JIPipe
The building blocks that are formed into a pipeline are called nodes. There are thousands of nodes available in JIPipe, each representing a different data processing step. The visual programmer (you) then combines the building blocks in a suitable order to achieve the desired results.
To allow data to be transferred between nodes, each comes with a set of input and output slots. As shown in the example above, the inputs and outputs can be connected.
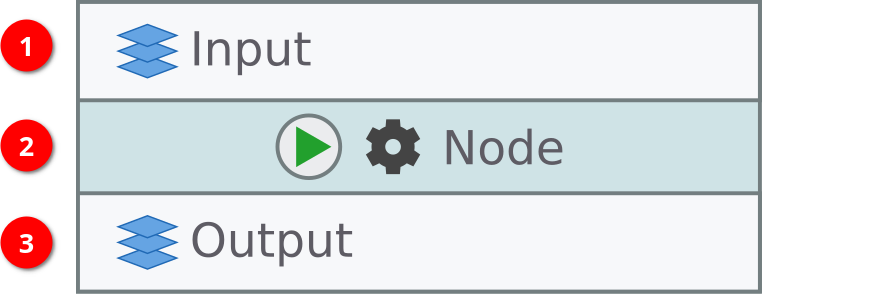
In JIPipe, inputs ➊ are always located at the top of a node and colored light gray. They are also always named (usually "Input"). Any outputs ➋ that are produced by the node are put into the output slots at the bottom. Outputs also have a name, as well as the node itself ➌.

Data types
JIPipe is designed to make it as conveniently as possible to work with a variety of different data types, including images, tables, ROI, 3D objects, AI models, and more. This affects the data consumed and produced by various nodes. For example Find particles 2D consumes a Mask, but produces ROI and measurement tables.
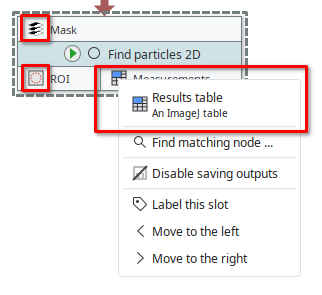
JIPipe indicates the data type of each slot via a representative icon next to the slot name. Additionally, you can right-click the slot to display a full description of the data type.

Converting data types
The data type system ensures that JIPipe is capable of automatically converting data to the correct format without involving any additional operation by the developer. For example, JIPipe ensures that images are converted to the correct bit depth.