Track analysis of unlabeled nematodes
Live worms of the species C. elegans were recorded via transmitted light microscopy. The resulting time-series images are analyzed by a JIPipe pipeline.
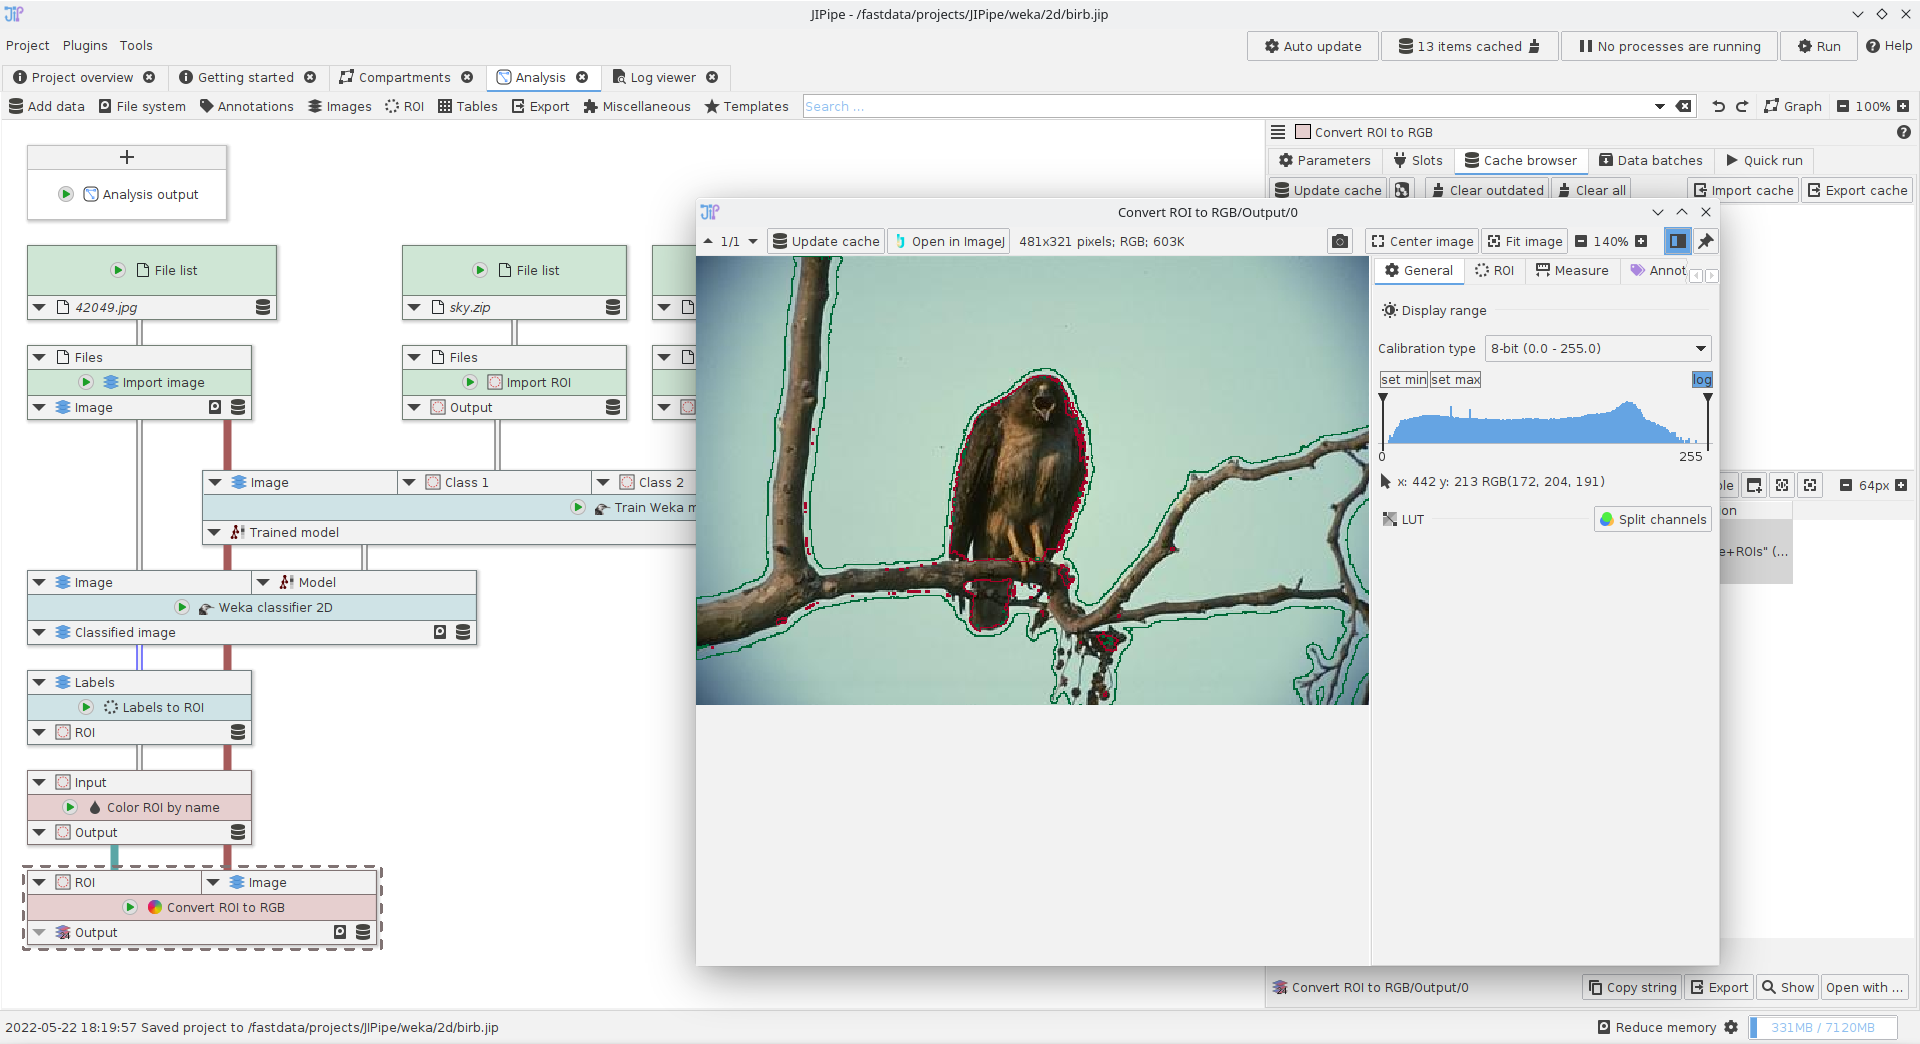
Using the Weka segmentation nodes
A small example showcasing how to utilize the Trainable Weka Segmentation nodes.
Tutorial: cellpose training
Accompanying data and project for the tutorial ‘Cellpose training’.

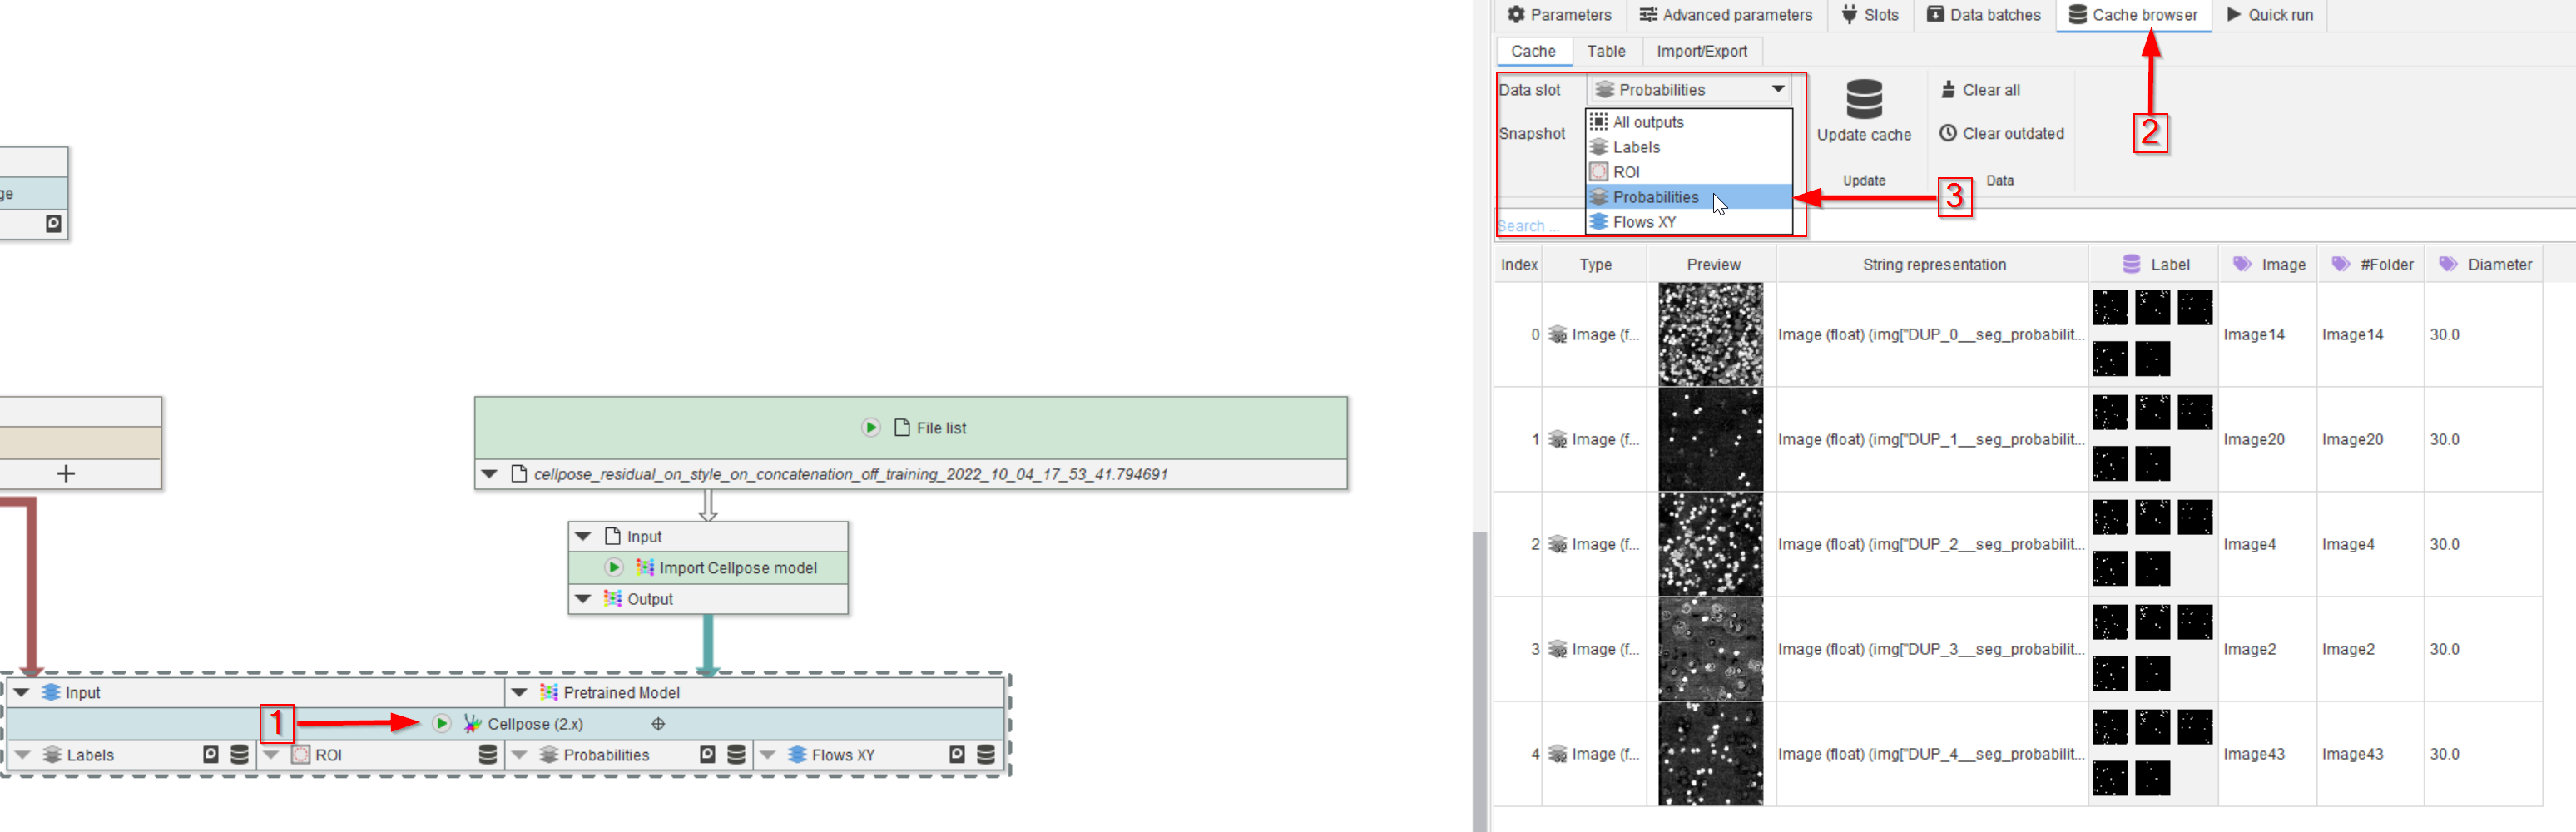
Tutorial: cellpose segmentation
Accompanying data and project for the tutorial ‘Cellpose segmentation’.
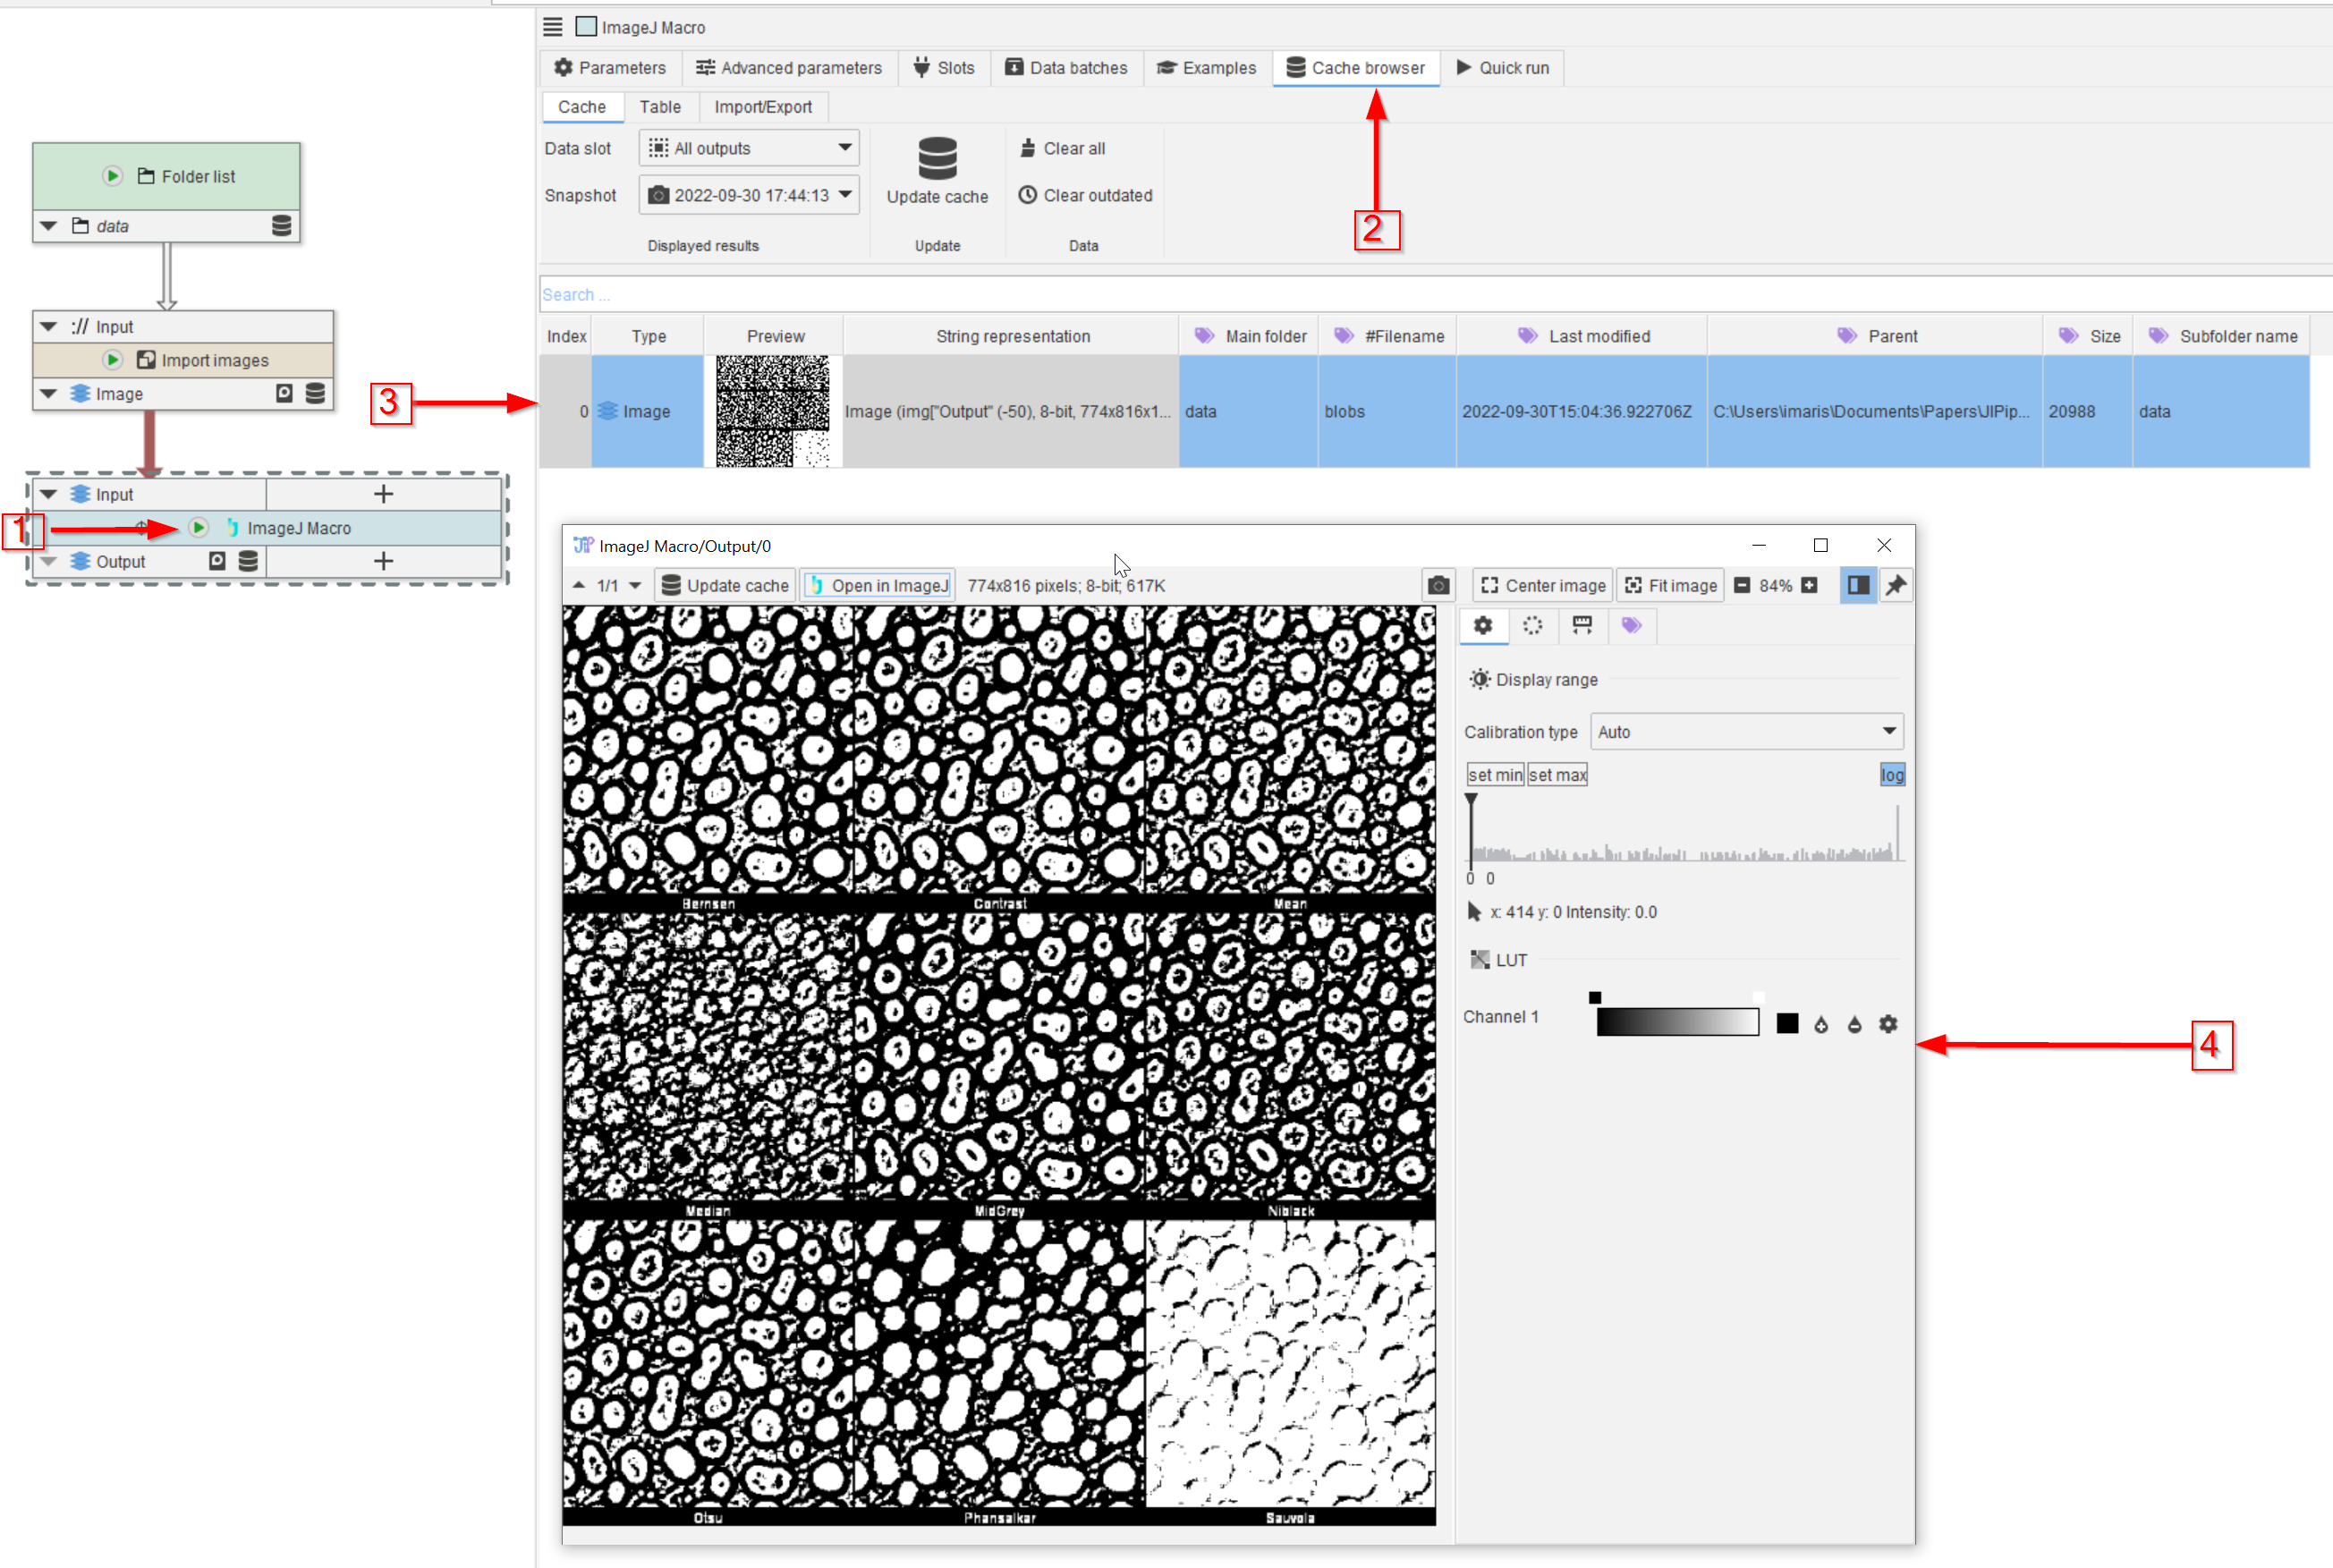
Tutorial: integrating ImageJ macros
Accompanying data and project for the tutorial ‘Integrating ImageJ macros’.
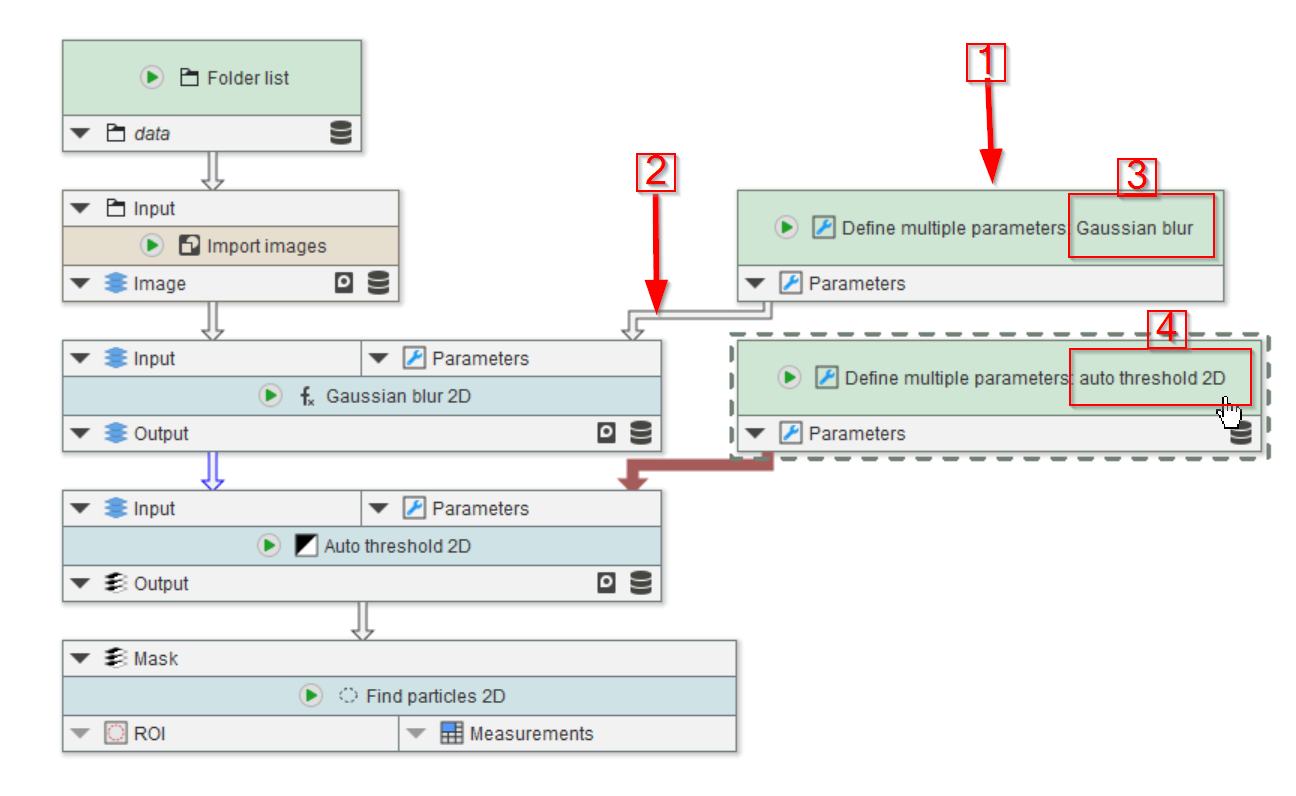
Tutorial: applying multiple parameter sets
Accompanying data and project for the tutorial ‘Applying multiple parameter sets’.
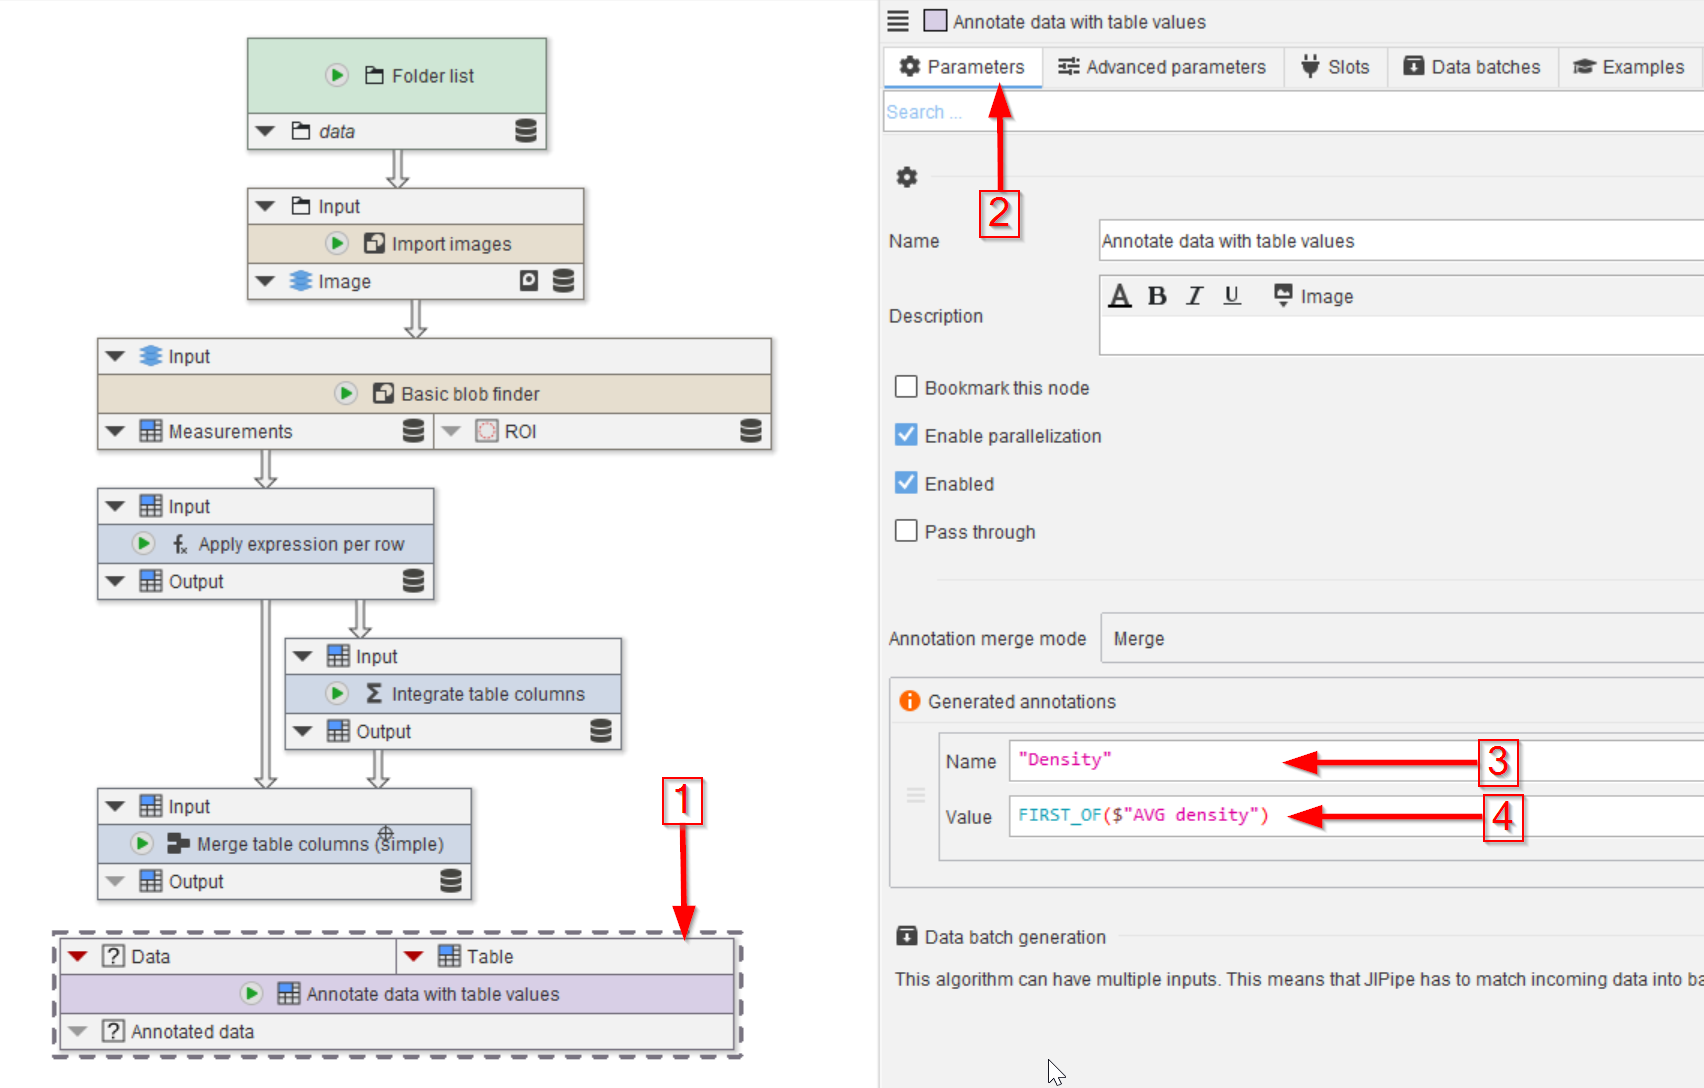
Tutorial: Annotating data with measurements
Accompanying data and project for the tutorial ‘Annotating data with measurements’.
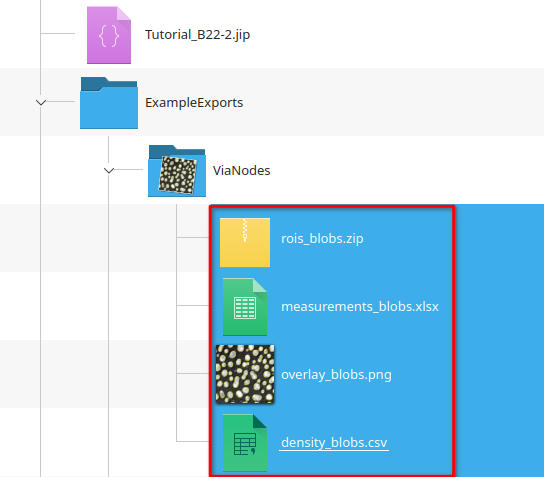
Tutorial: Exporting data
Accompanying data and project for the tutorial ‘Exporting data’.
Tutorial: processing tables
Accompanying data and project for the tutorial ‘Processing tables’.
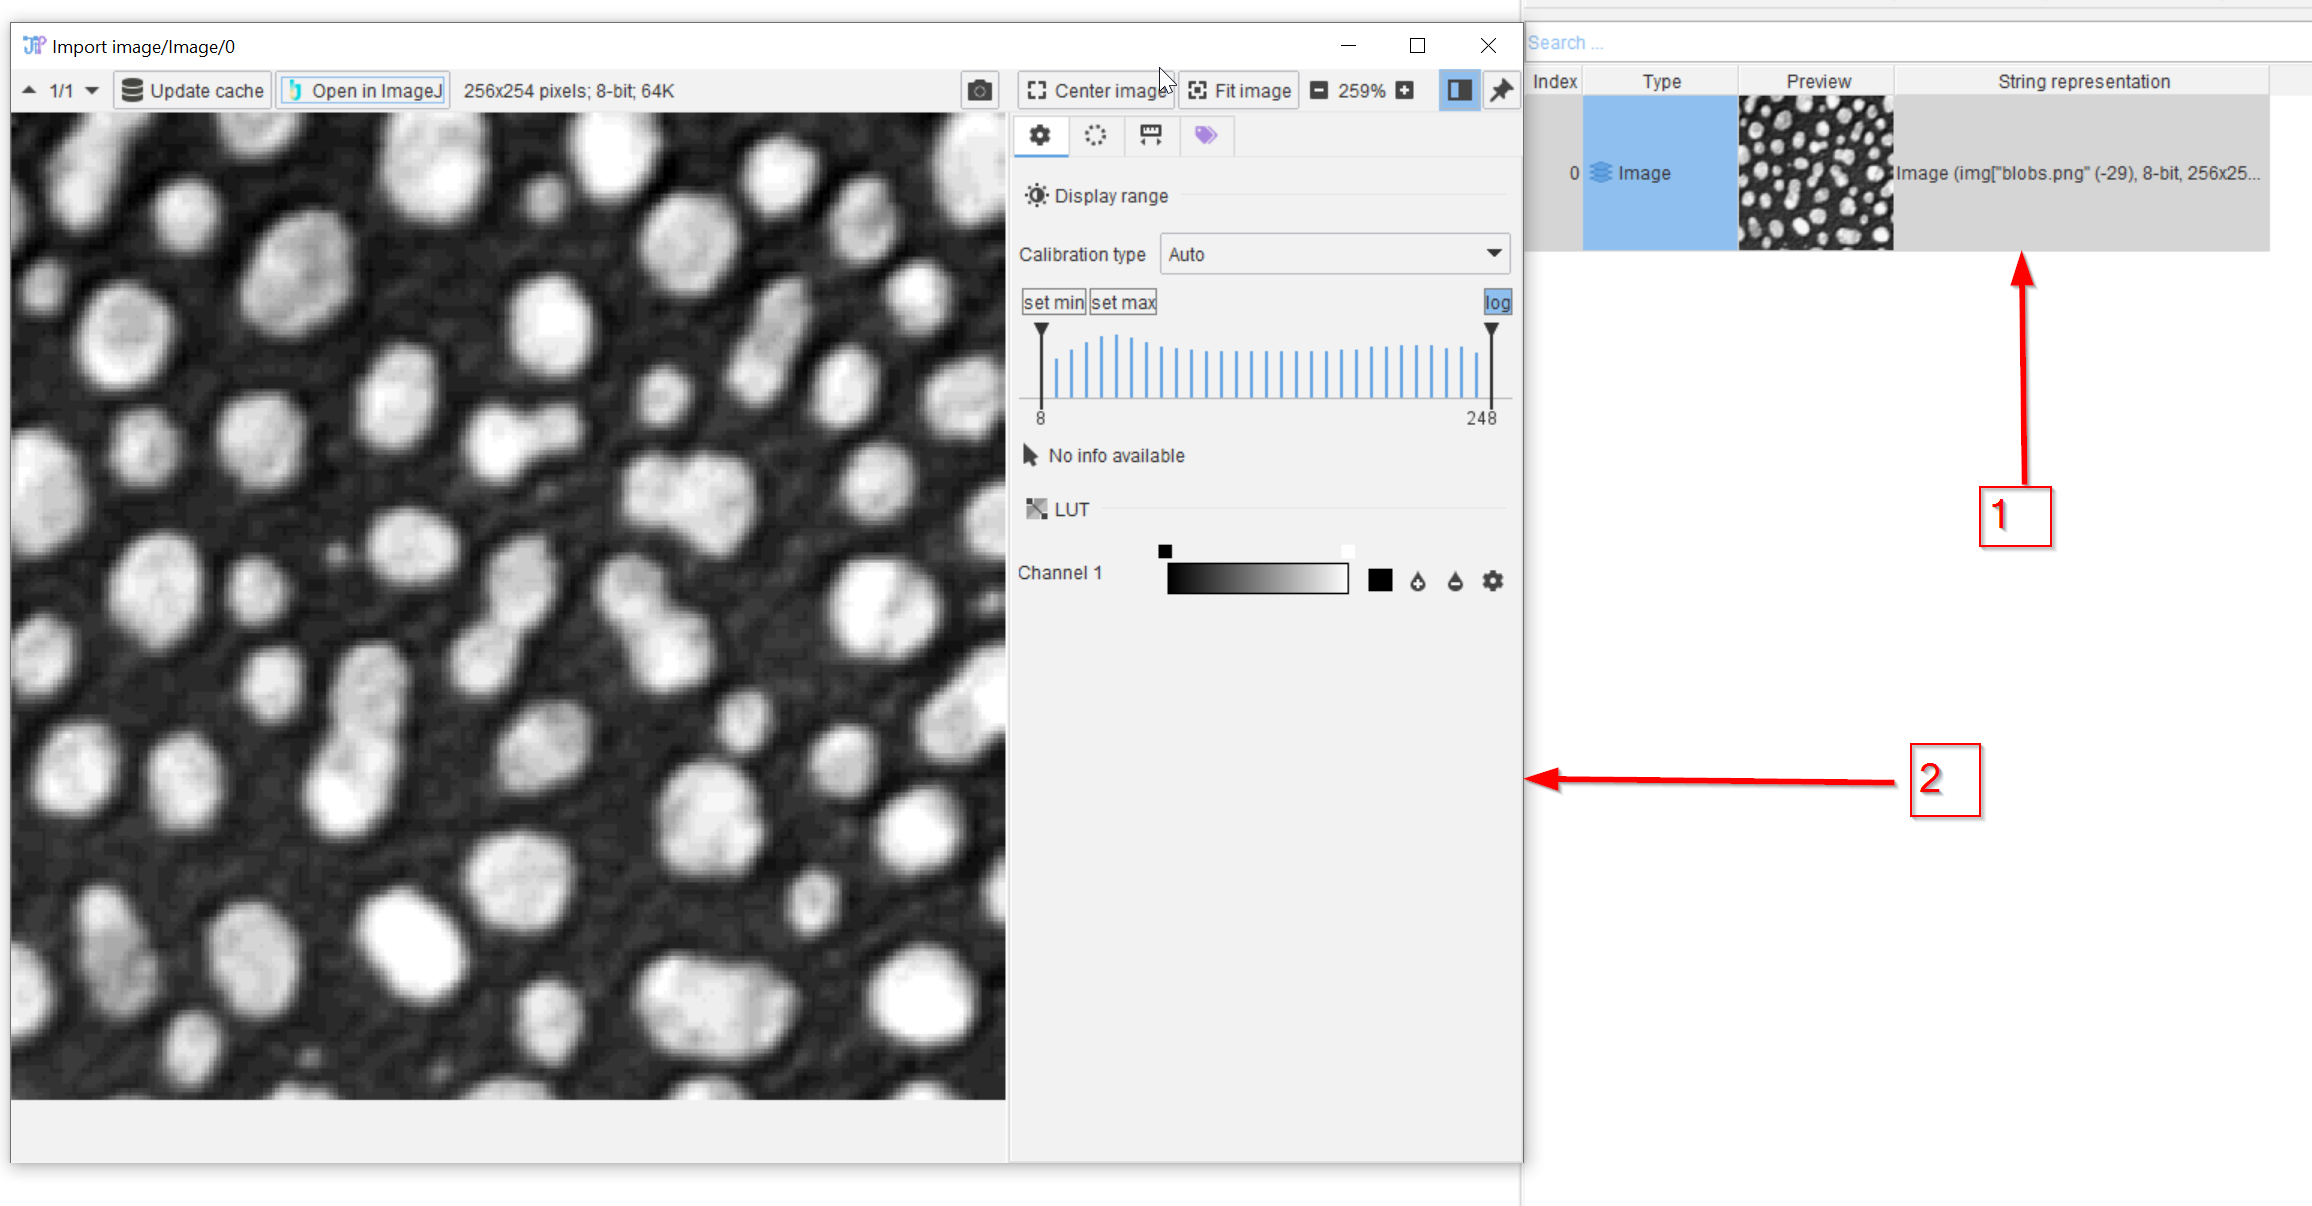
Tutorial: setting LUT and extracting image properties
Accompanying data and project for the tutorial ‘Setting LUT and extracting image properties’.
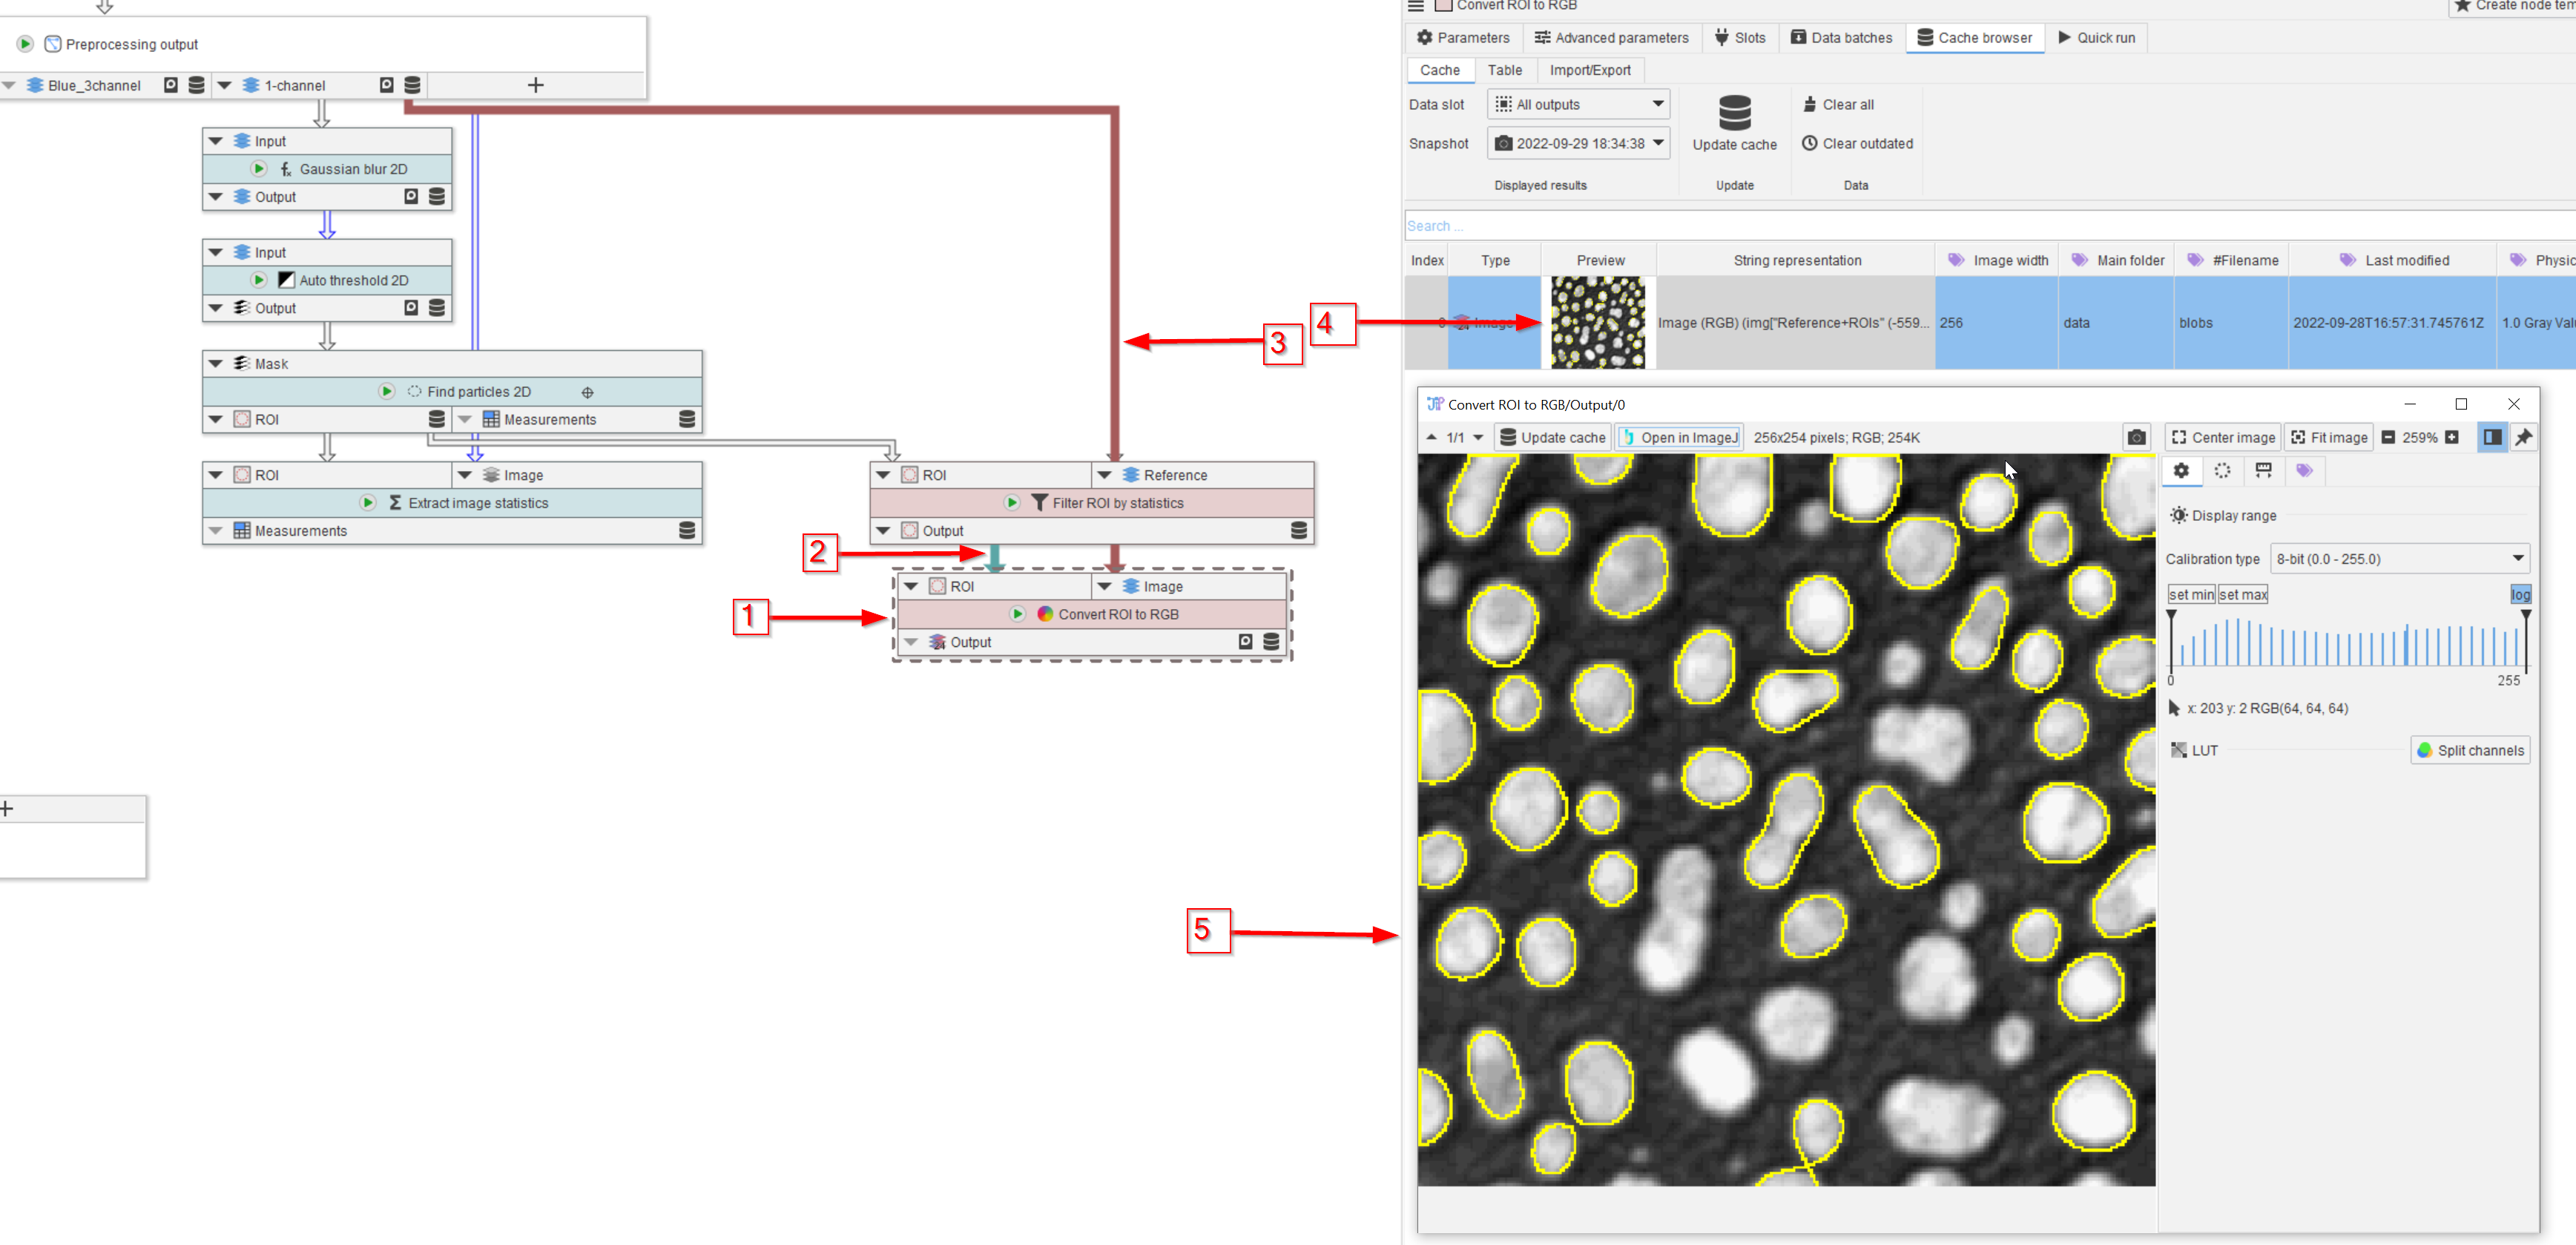
Tutorial: processing ROI
Accompanying data and project for the tutorial ‘Processing ROI’.
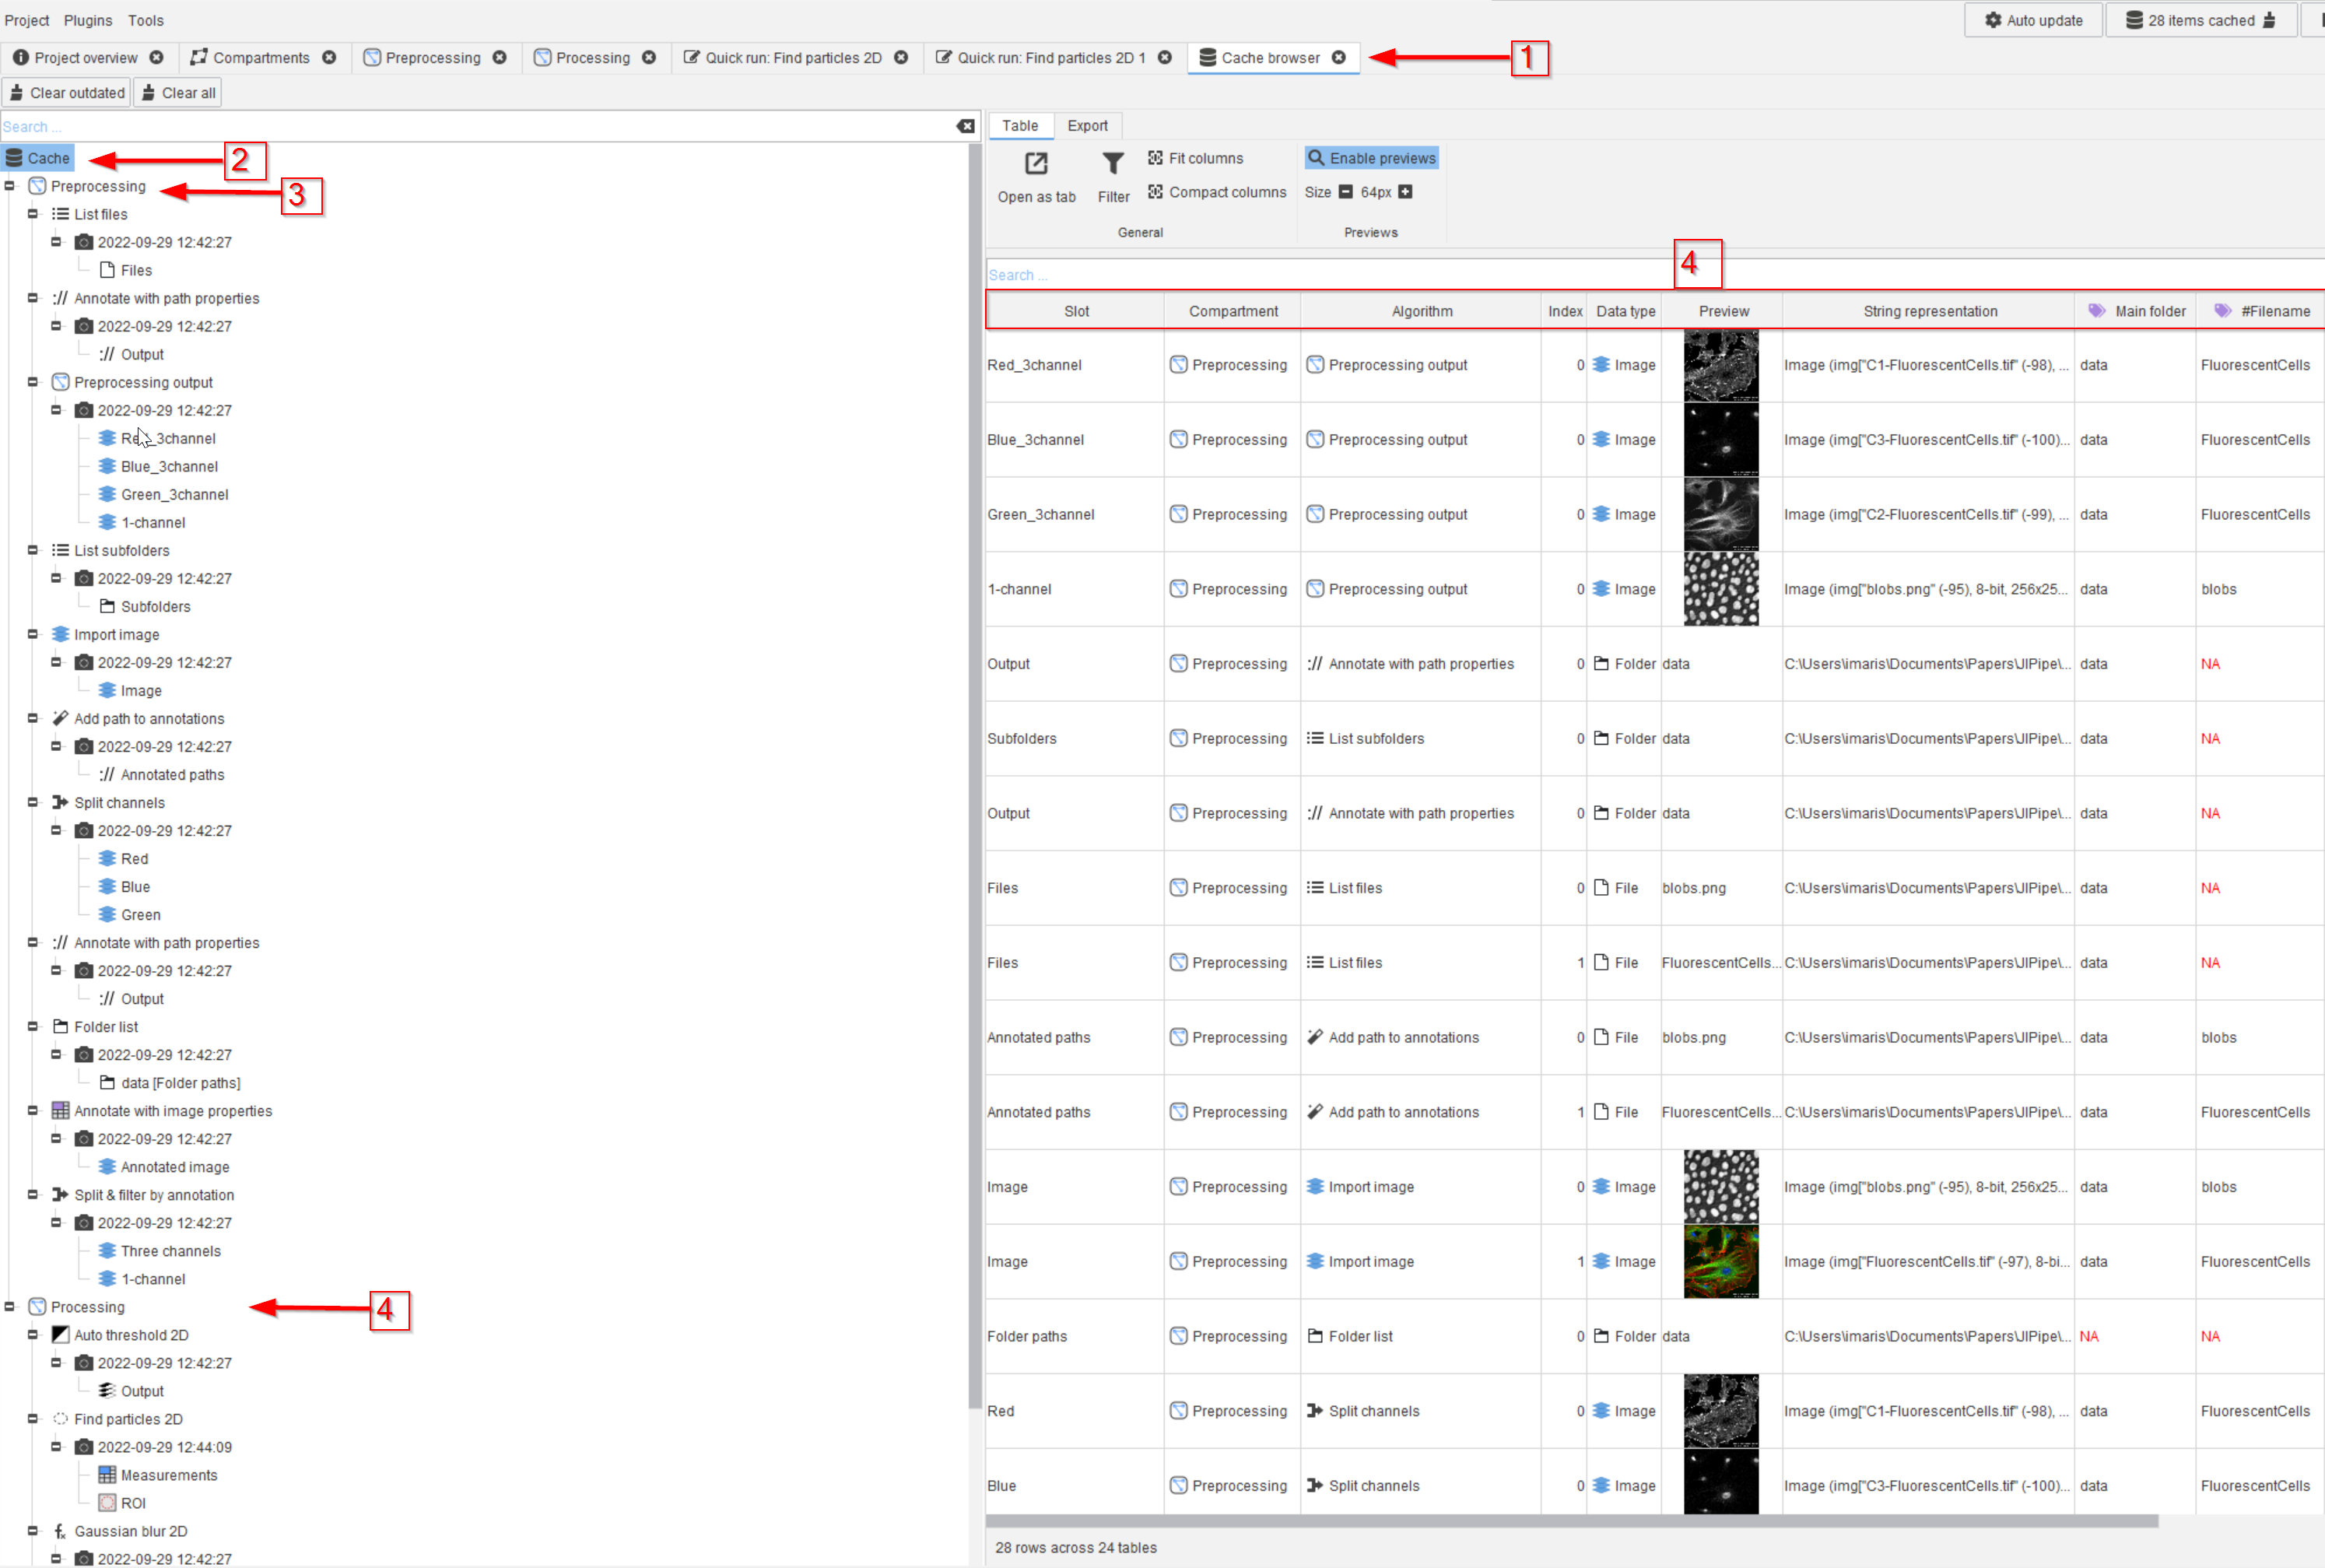
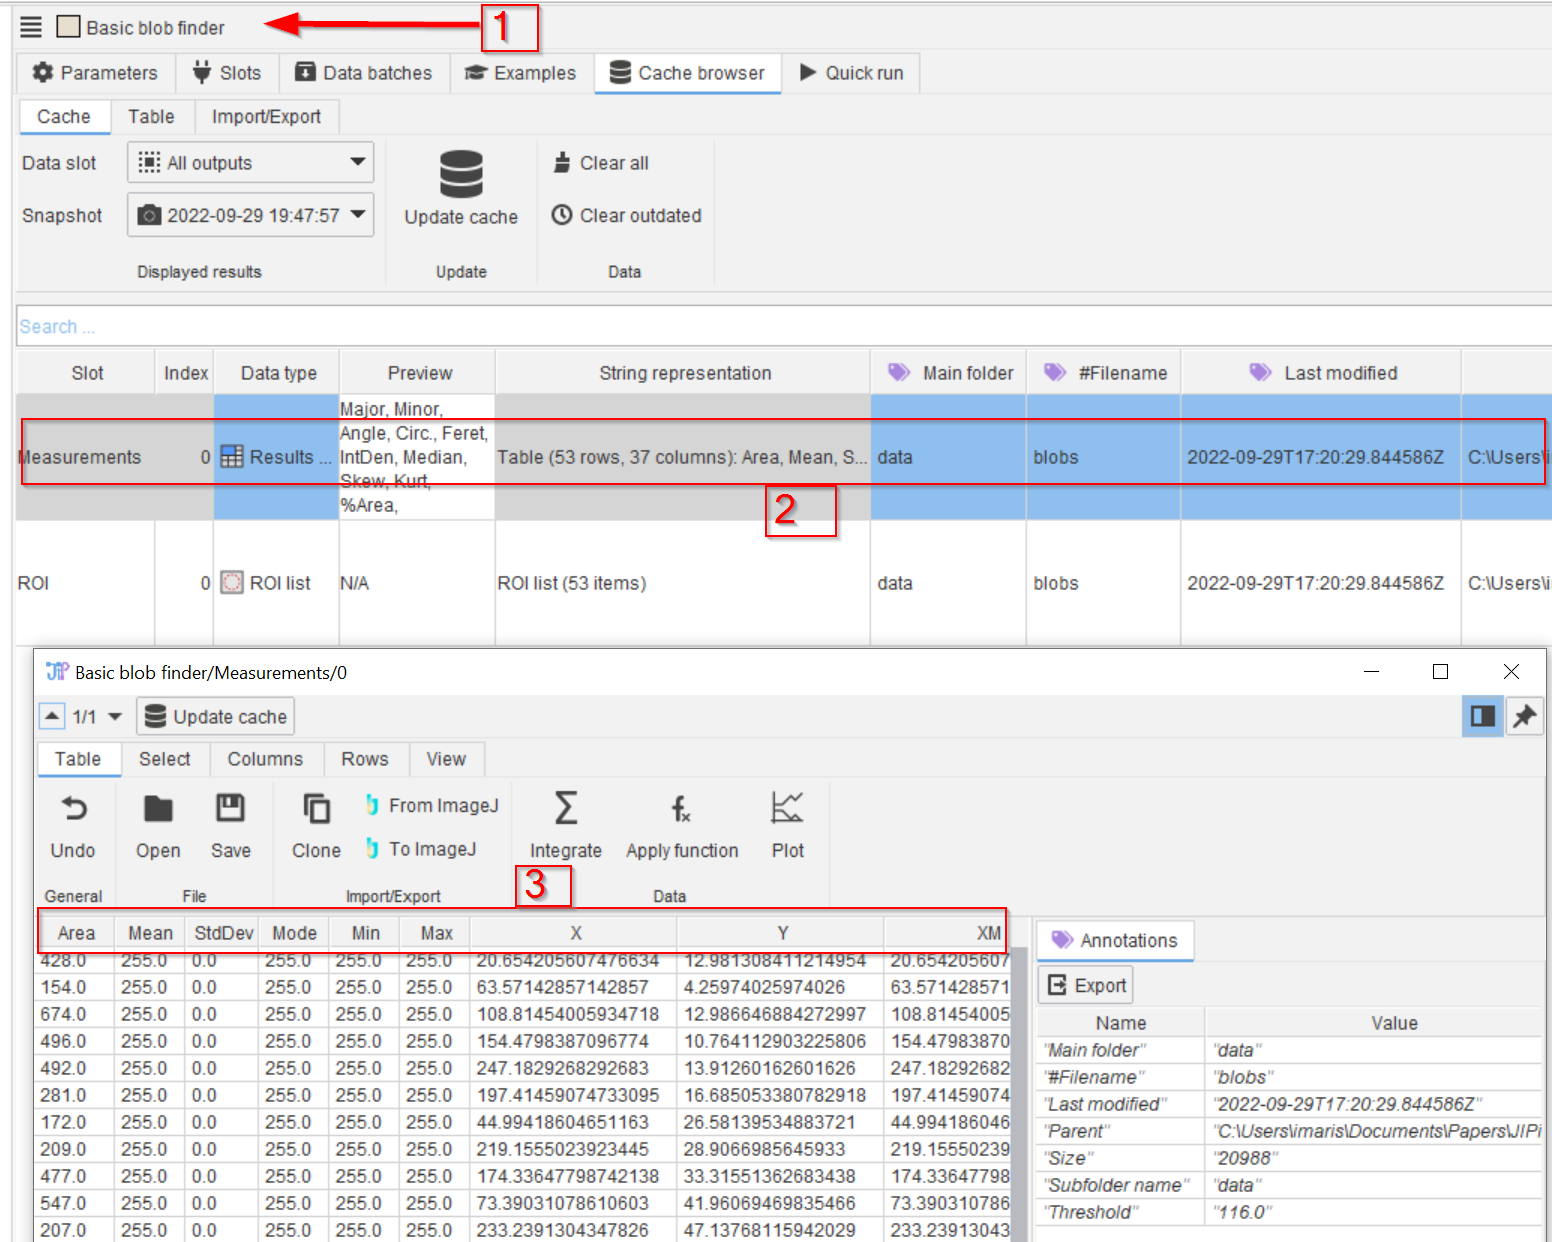
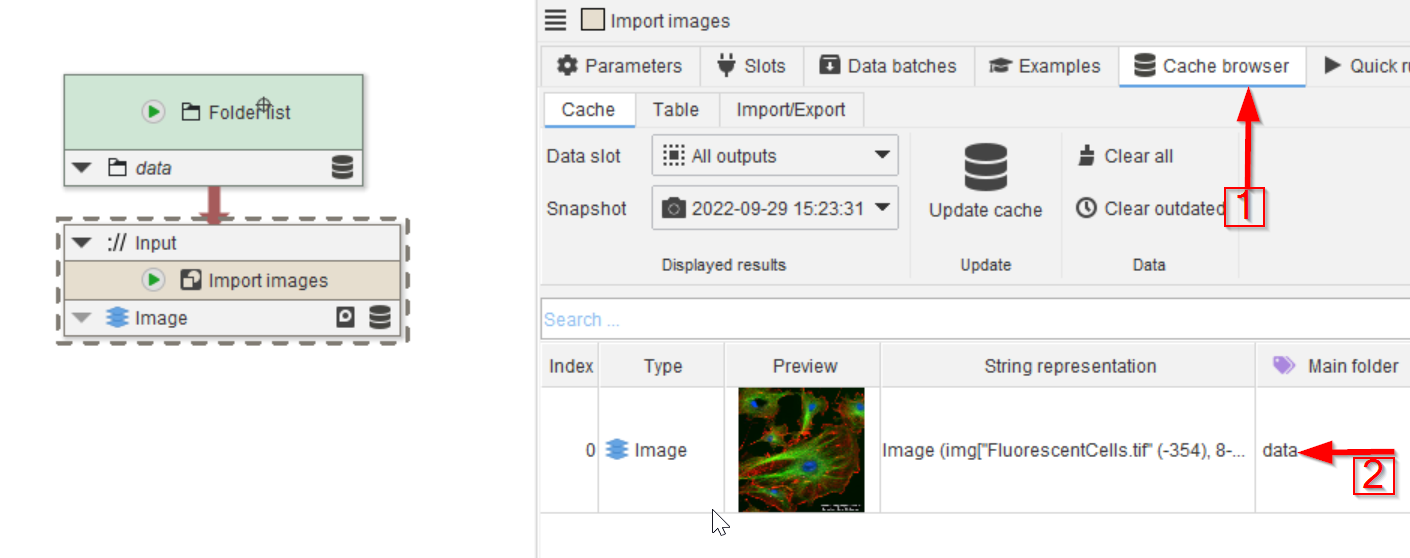
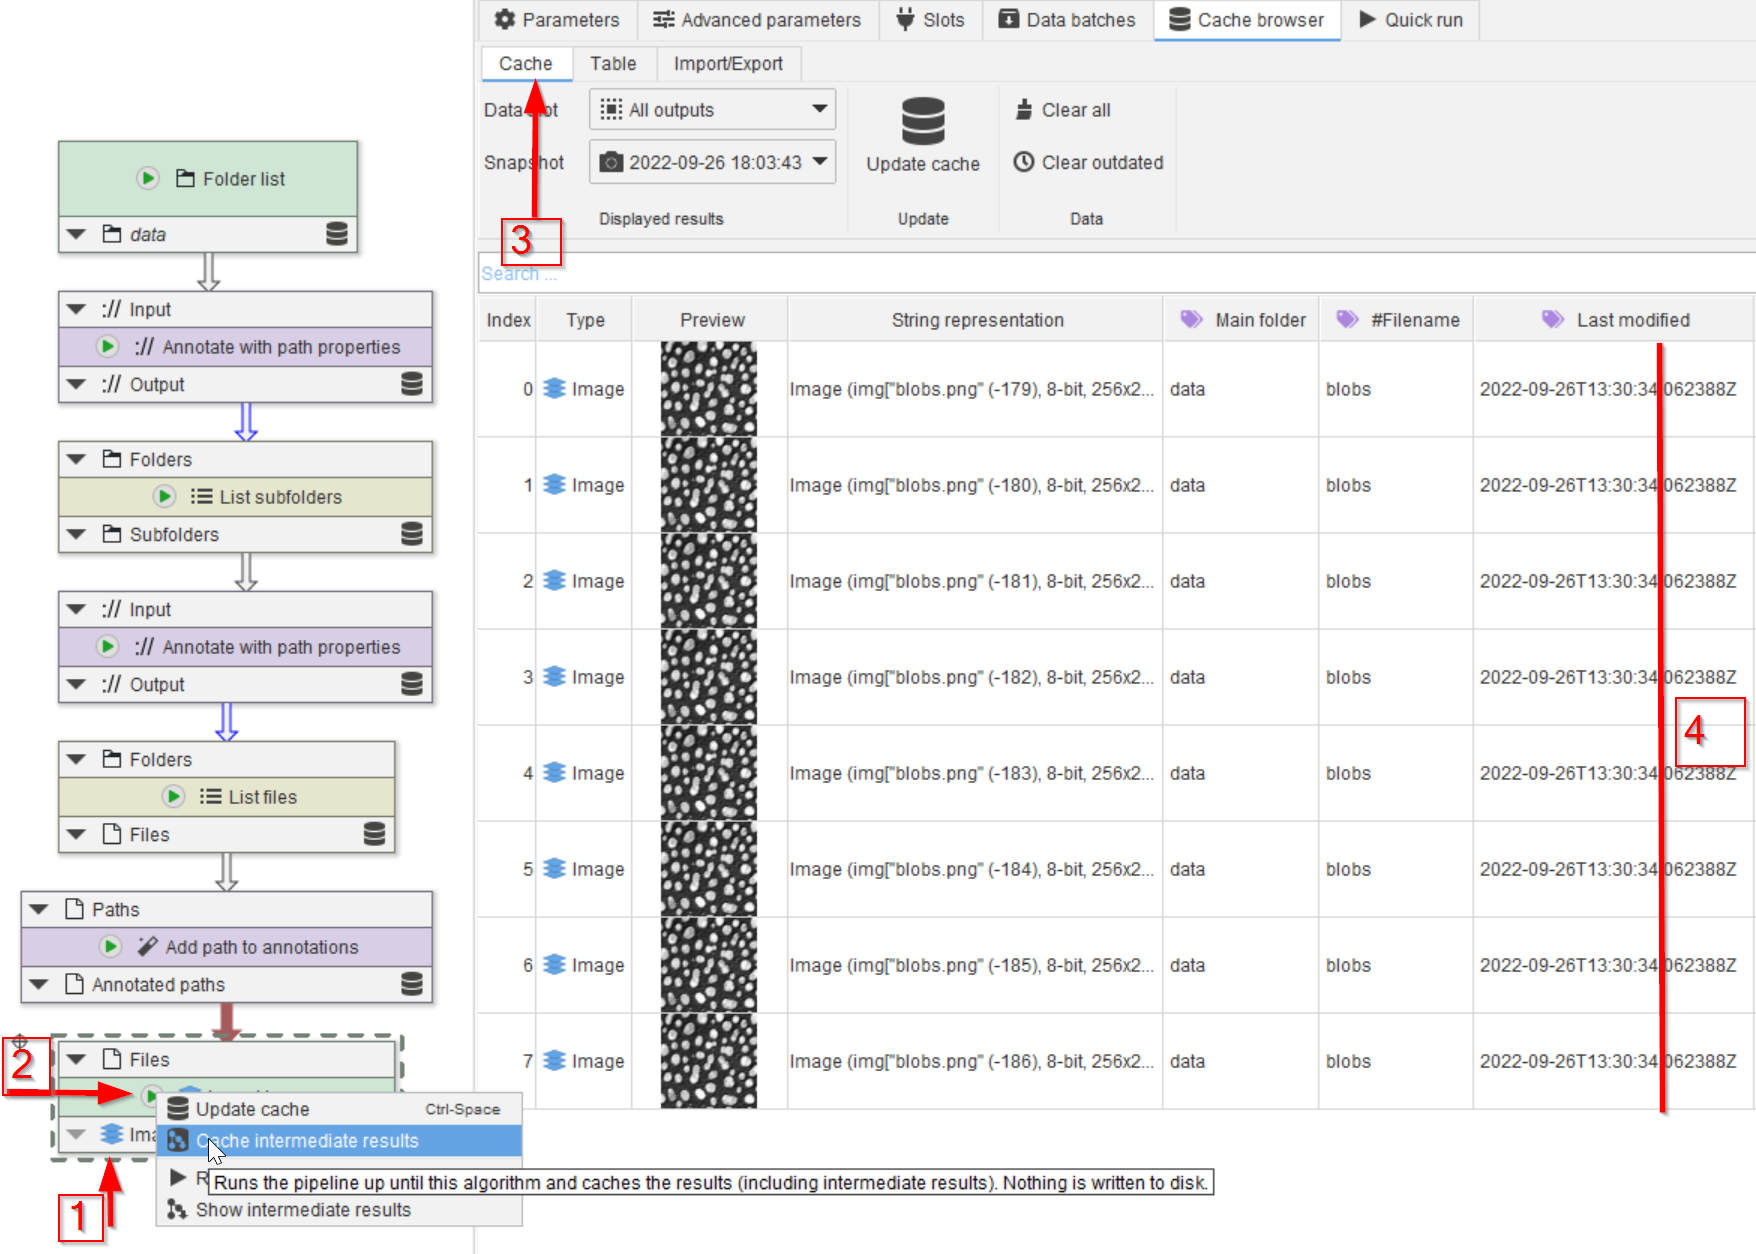
Tutorial: working with the cache (generating and displaying)
Accompanying data and project for the tutorial ‘Working with the cache: generating and displaying’.
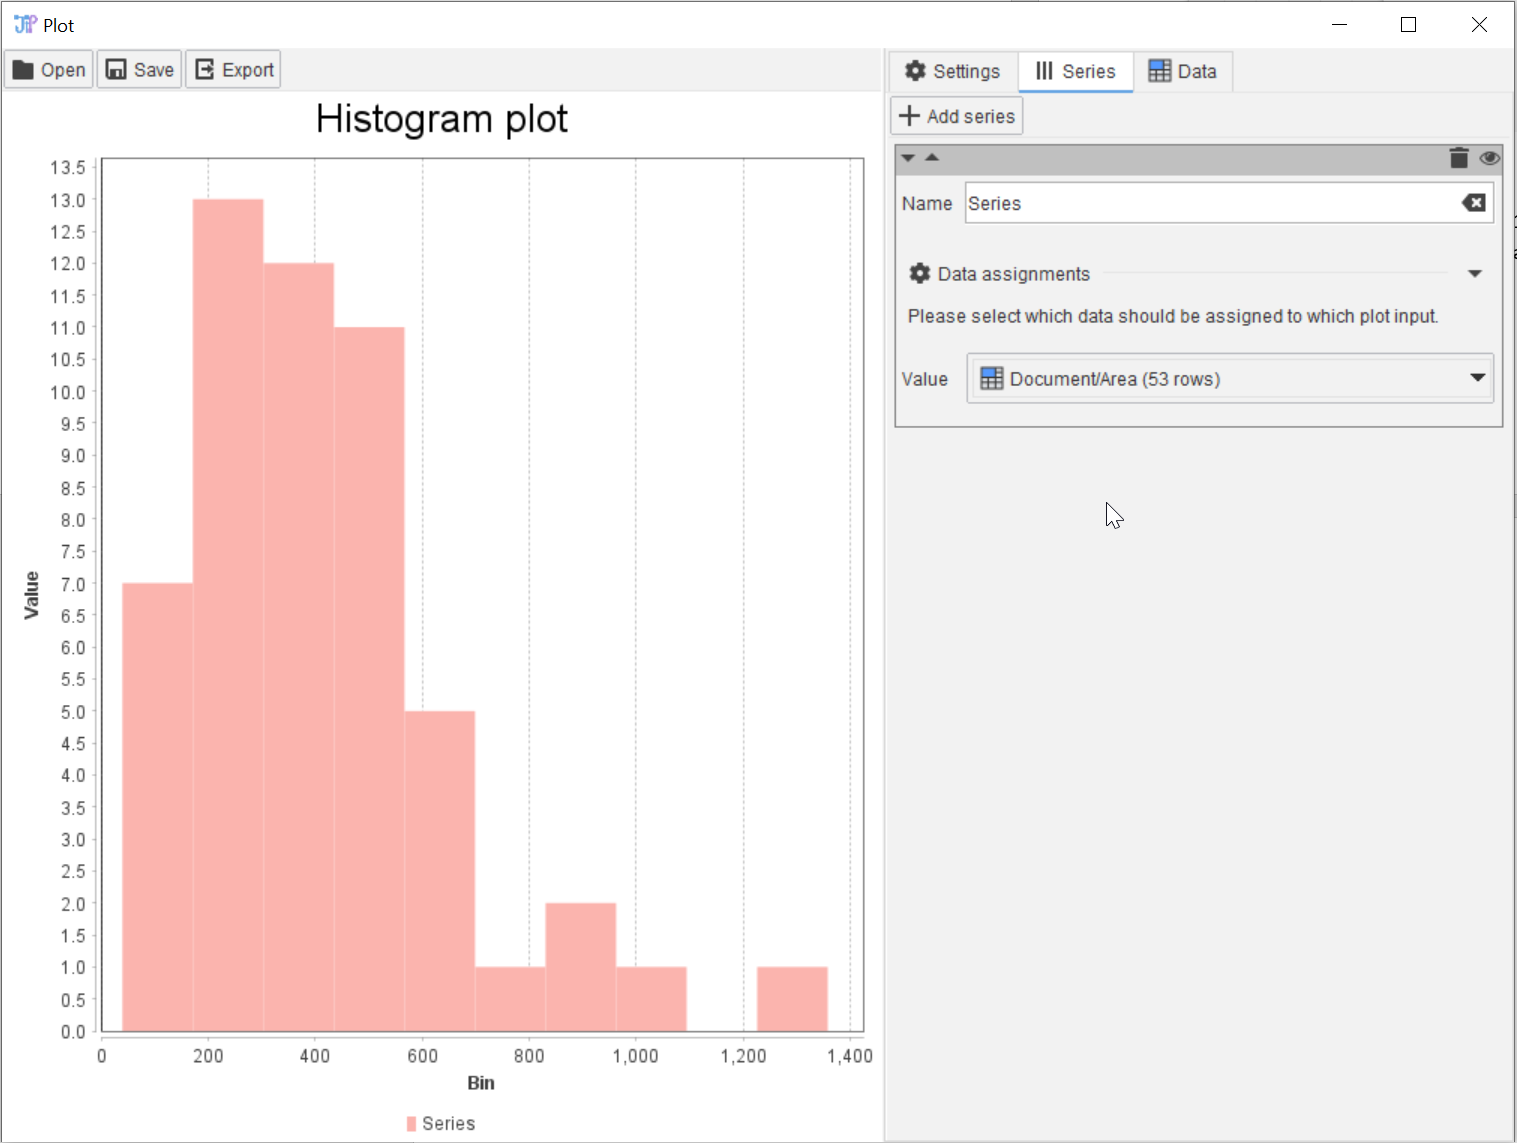
Tutorial: quantification and plotting
Accompanying data and project for the tutorial ‘Quantification and plotting’.
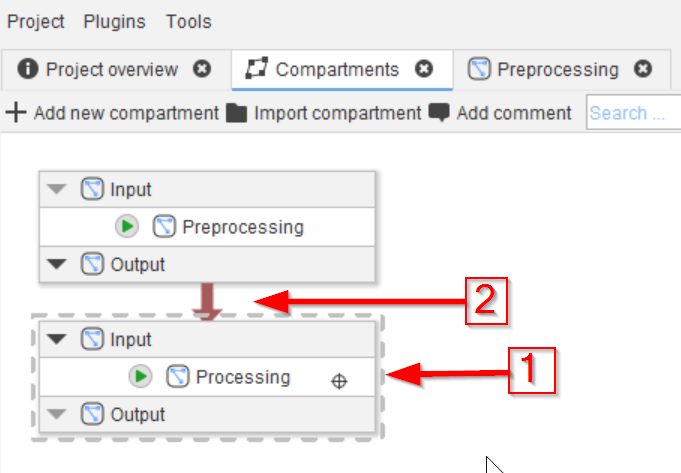
Tutorial: creating and connecting compartments
Accompanying data and project for the tutorial ‘Creating and connecting compartments’.
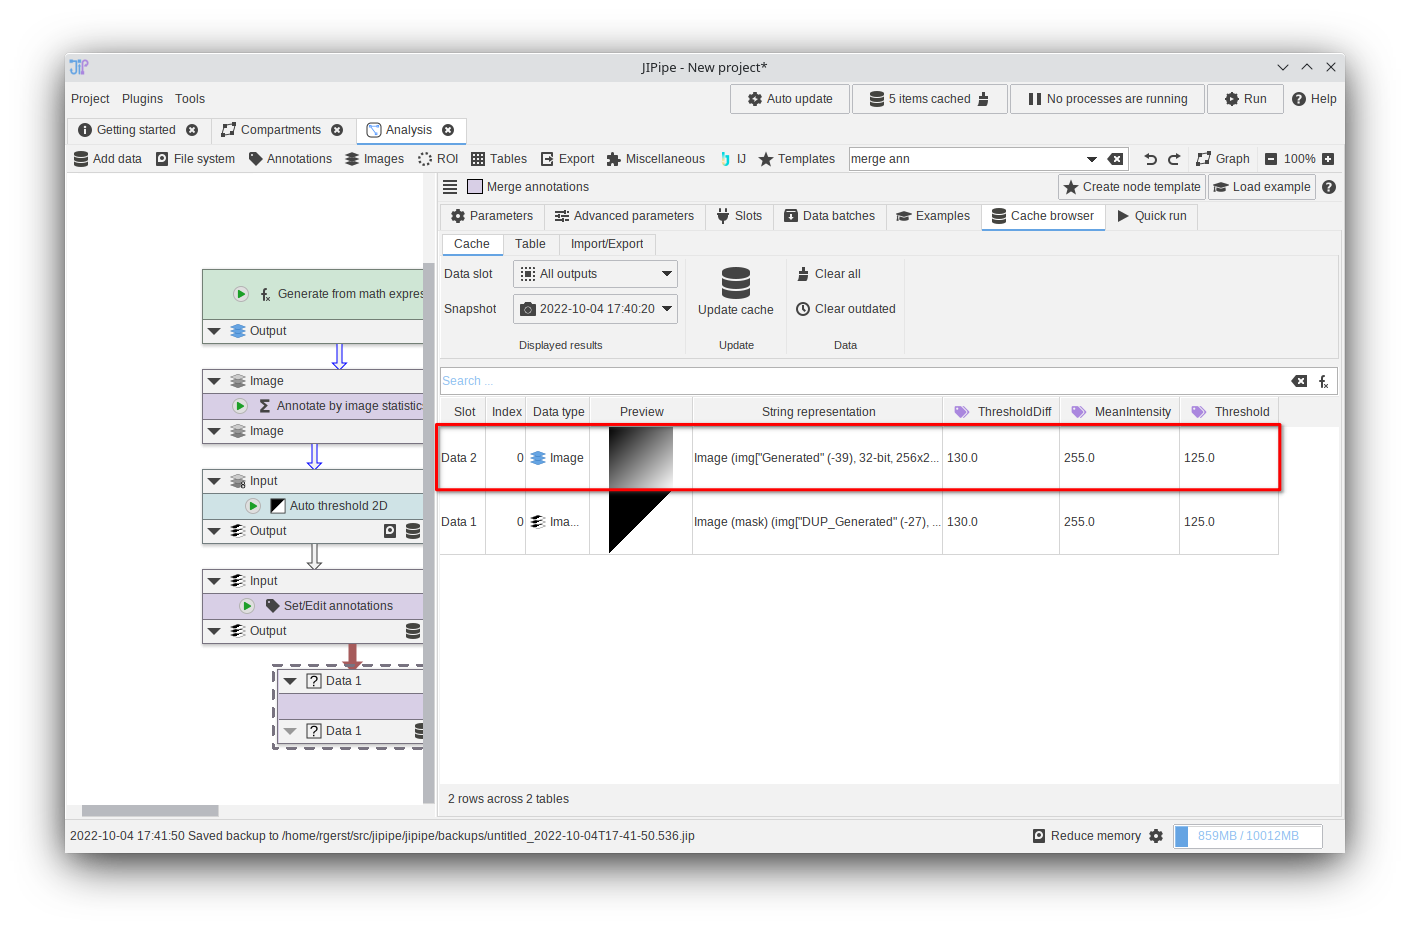
Tutorial: working with annotations (modifying and merging)
Accompanying data and project for the tutorial ‘Working with annotations: modifying and merging’.

Tutorial: working with annotations (branching)
Accompanying data and project for the tutorial ‘Working with annotations: branching’
Tutorial: working with annotations (filtering)
Accompanying data and project for the tutorial ‘Working with annotations: filtering’
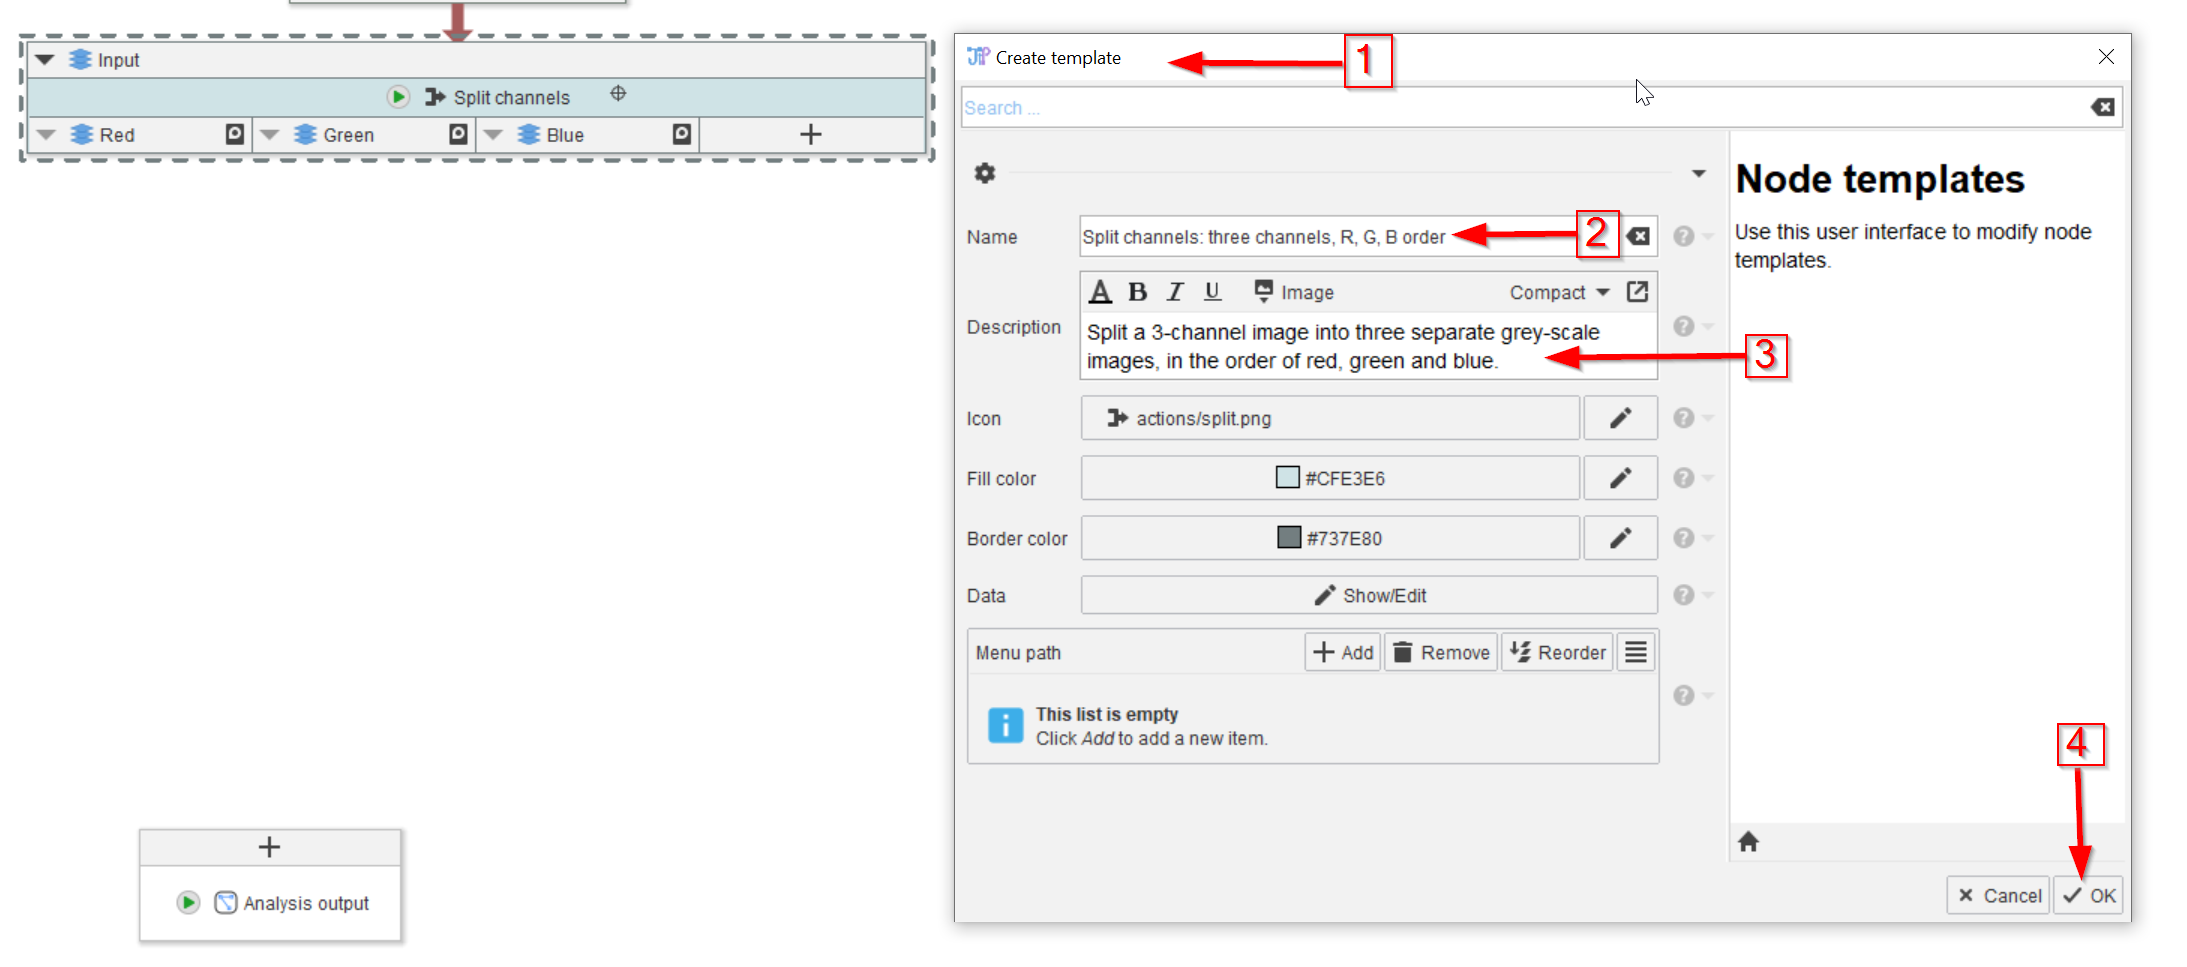
Tutorial: Creating node templates
Accompanying data and project for the tutorial ‘Creating node templates’.
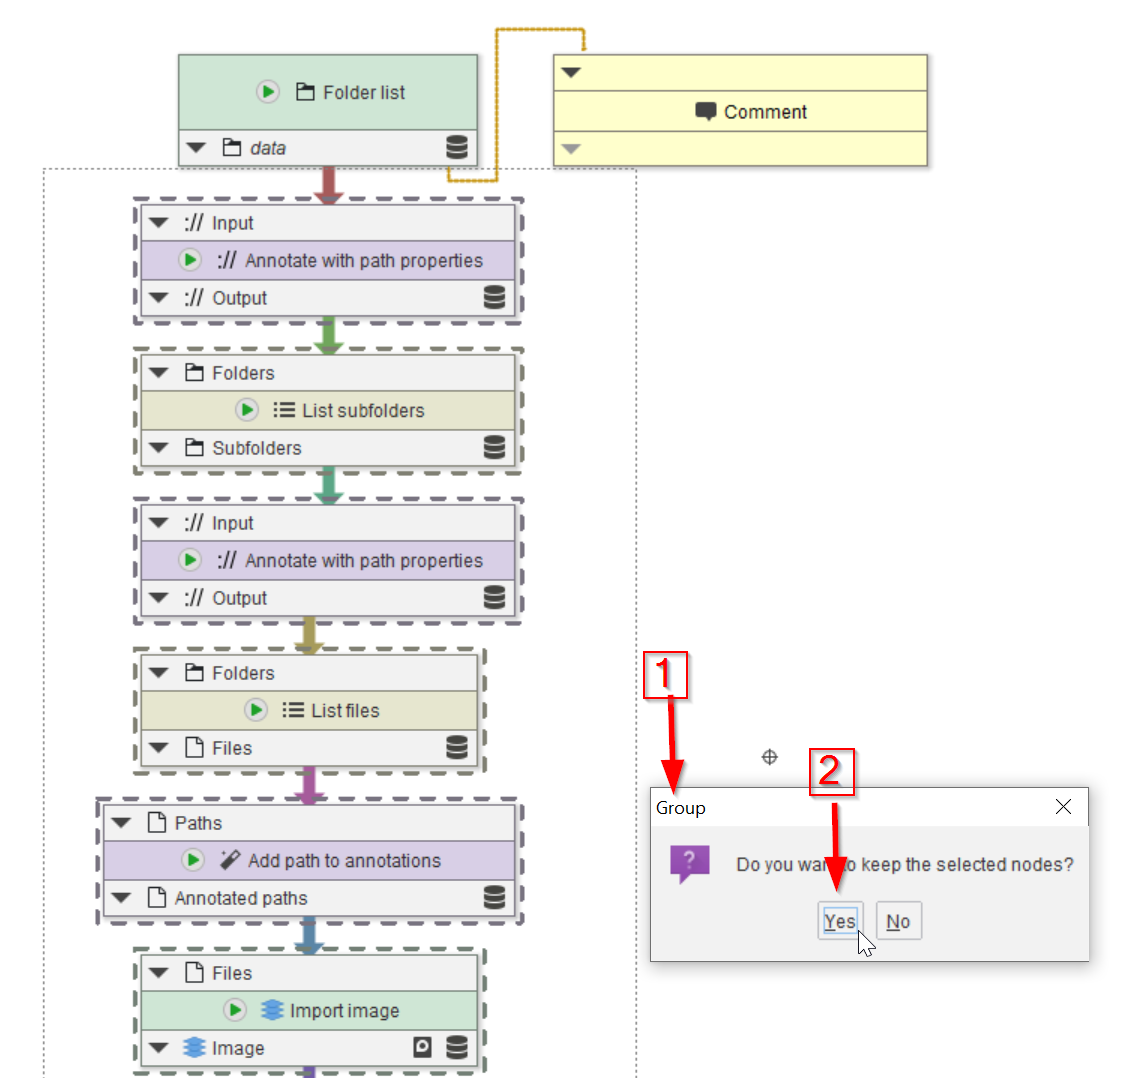
Tutorial: Creating node groups
Accompanying data and project for the tutorial ‘Creating node groups (1 and 2)’.
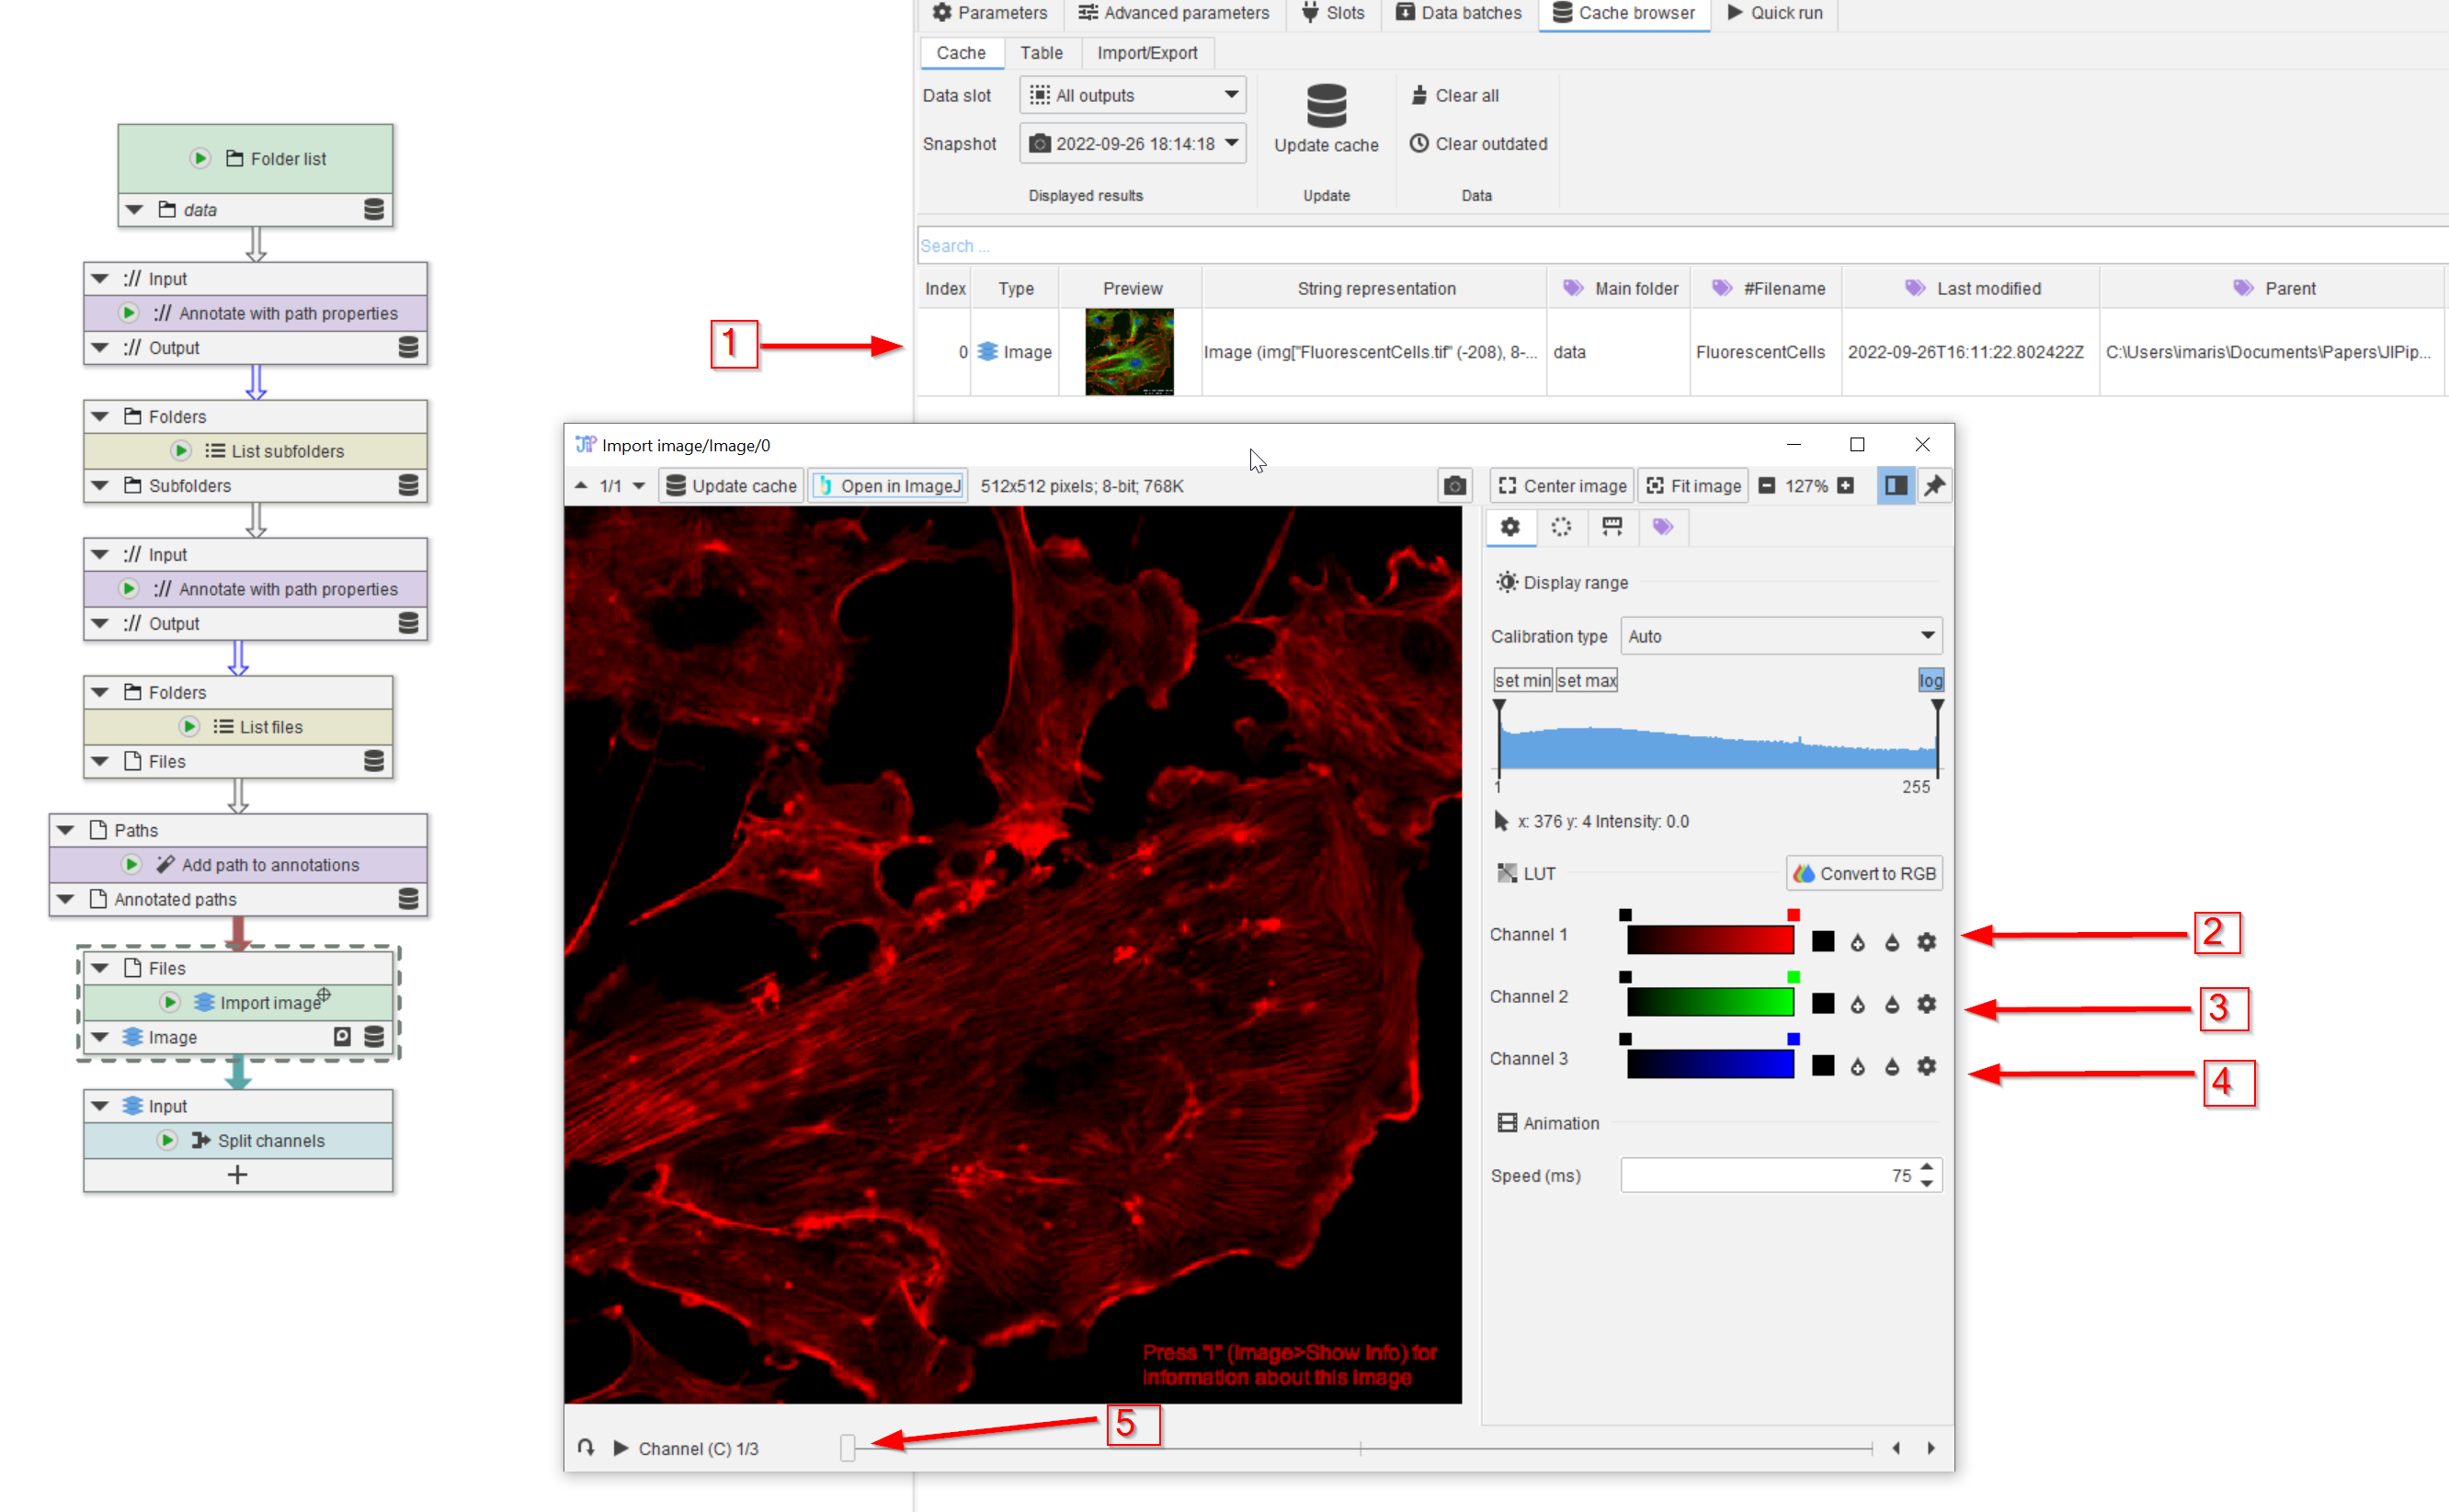
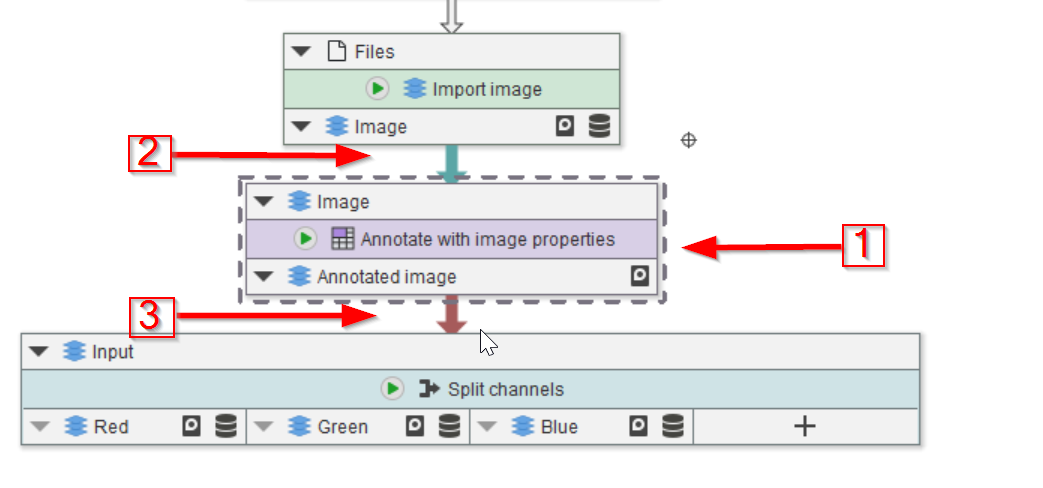
Tutorial: Splitting multi-channel images
Accompanying data and project for the tutorial ‘Splitting multi-channel images’.
Tutorial: importing a directory of images (2/2)
Accompanying data and project for the tutorial ‘Importing a directory of images (2/2)’.
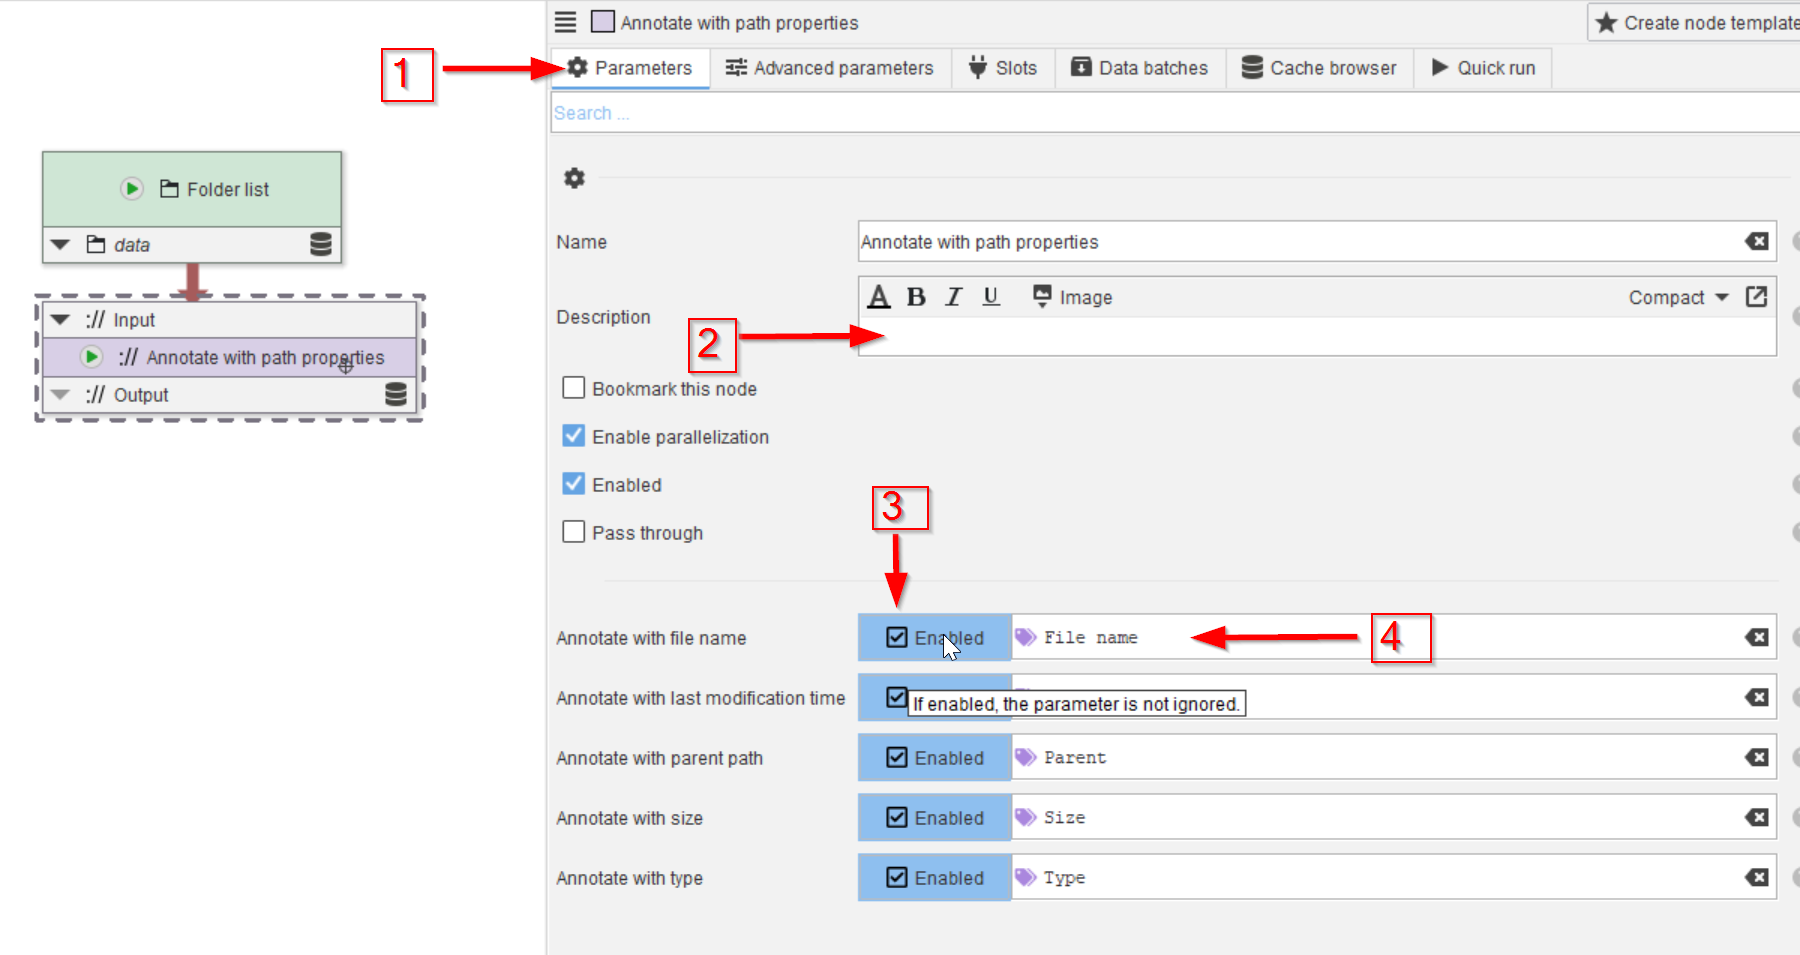
Tutorial: importing a directory of images (1/2)
Accompanying data and project for the tutorial ‘Importing a directory of images (1/2)’.
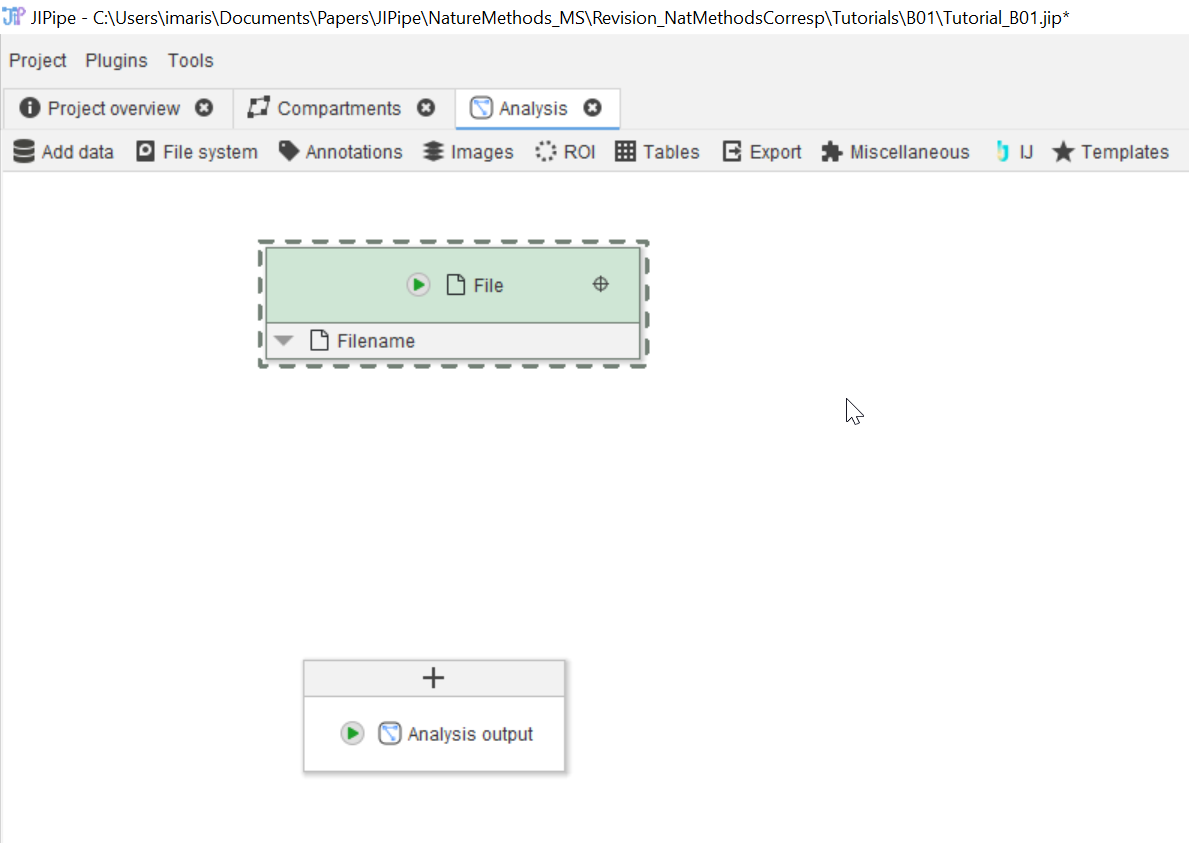
Tutorial: importing an image
Accompanying data and project for the tutorial series ‘Importing an image’.
Tutorial: adding and running nodes
Accompanying data and project for the tutorial ‘Adding and running nodes’.
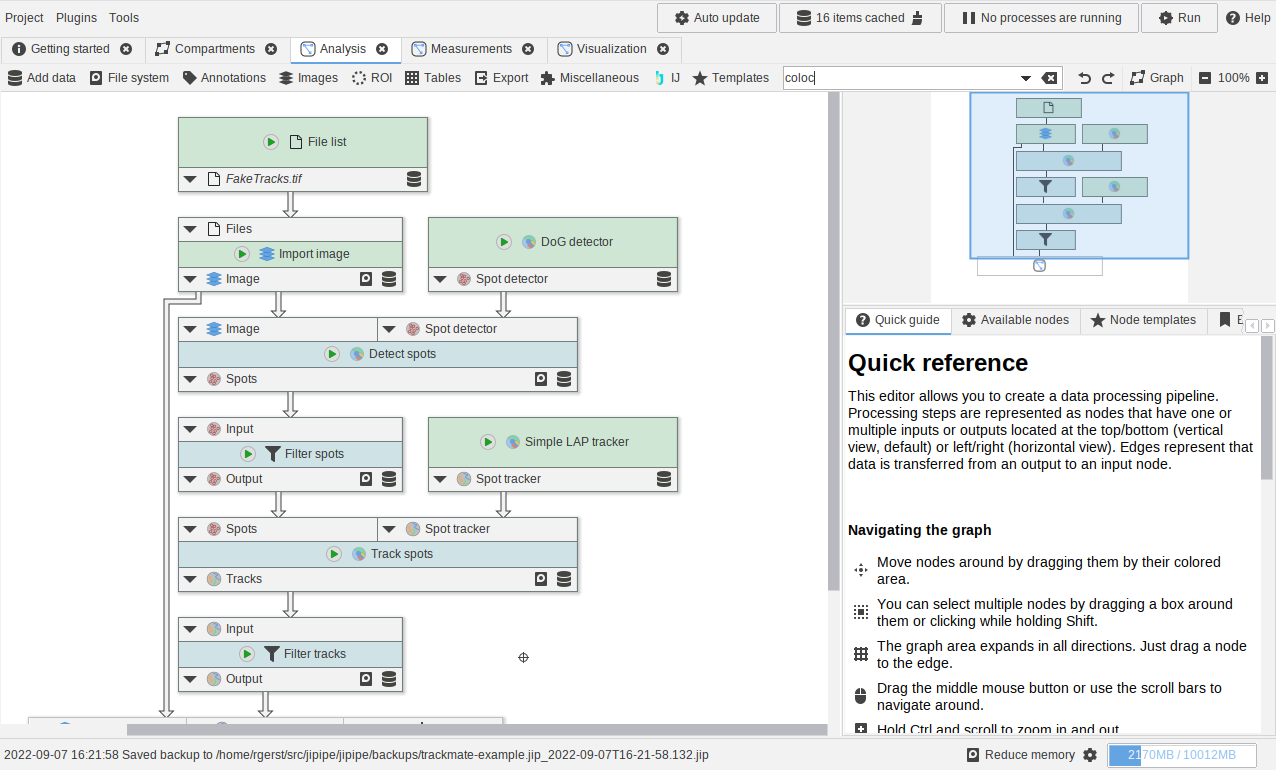
Using the TrackMate nodes
A small example showcasing how to utilize the TrackMate nodes.
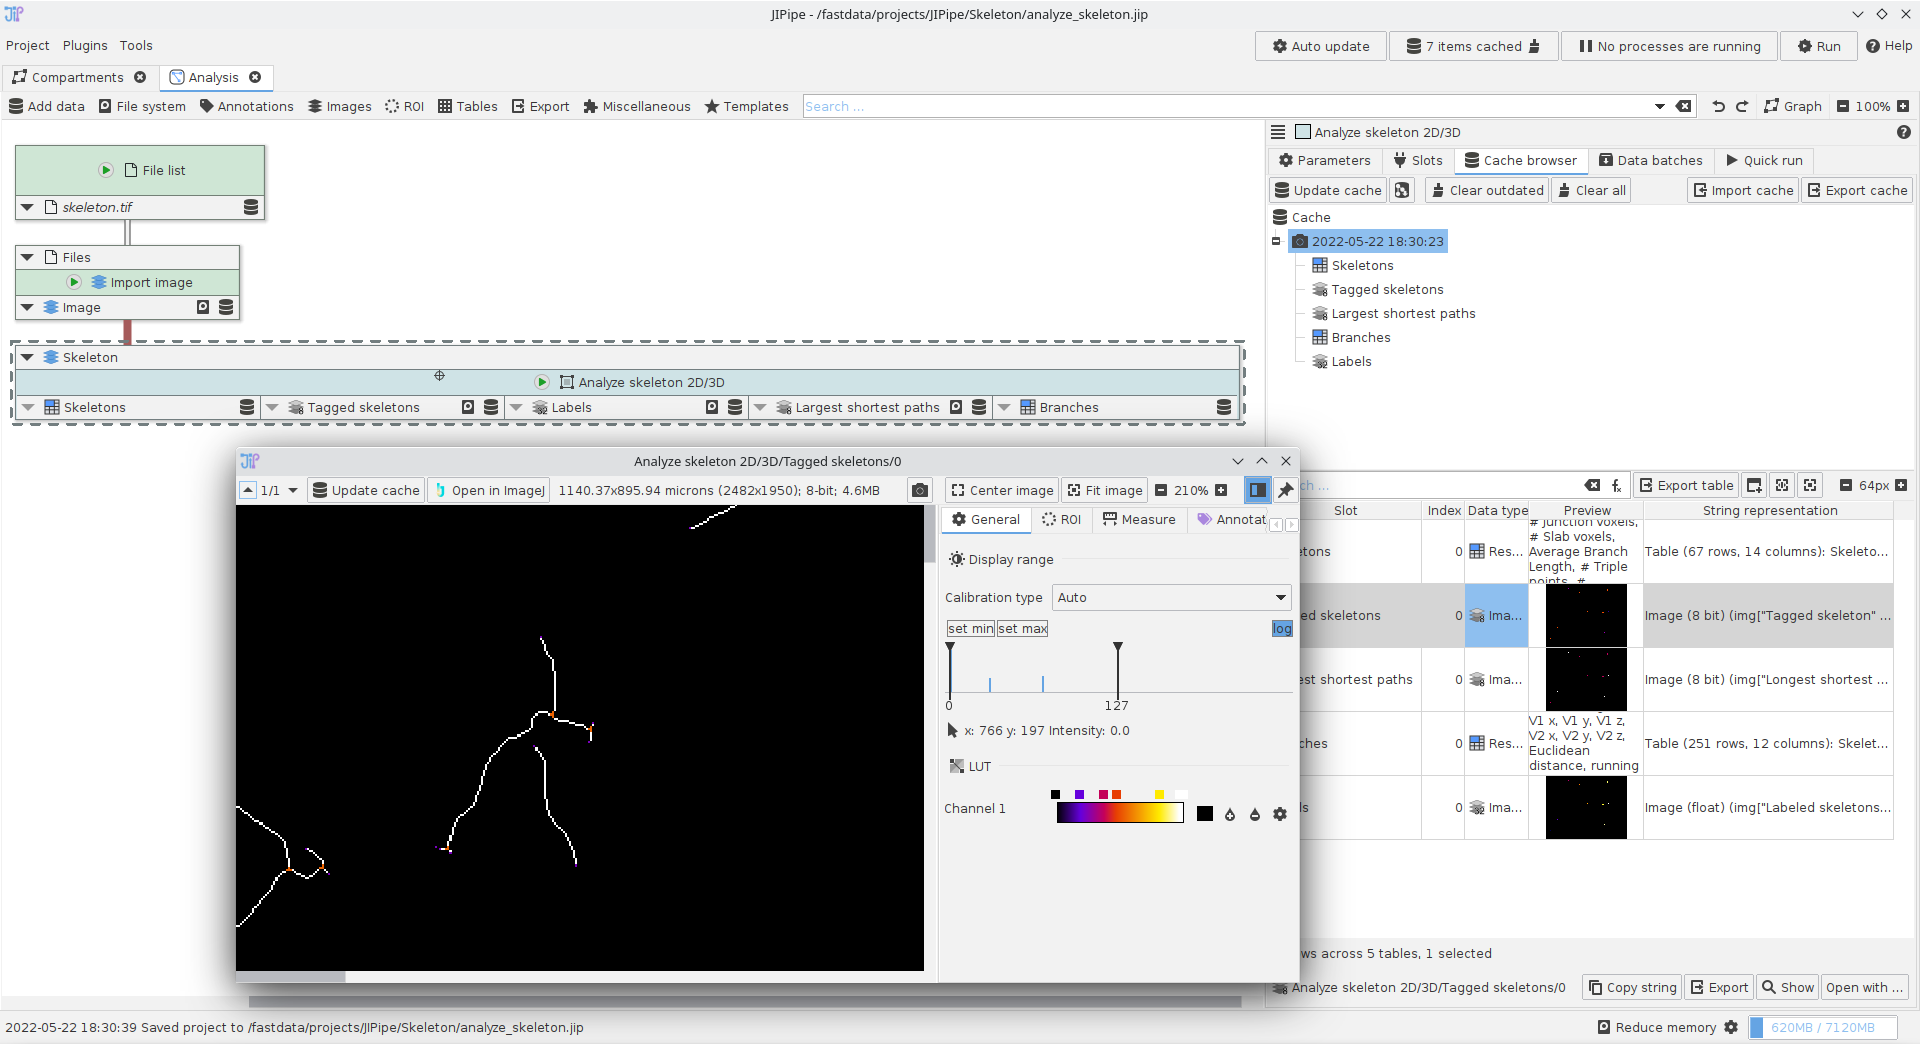
Using the Analyze skeleton 2D/3D nodes
A small example showcasing how to utilize the Analyze skeleton 2D/3D node.
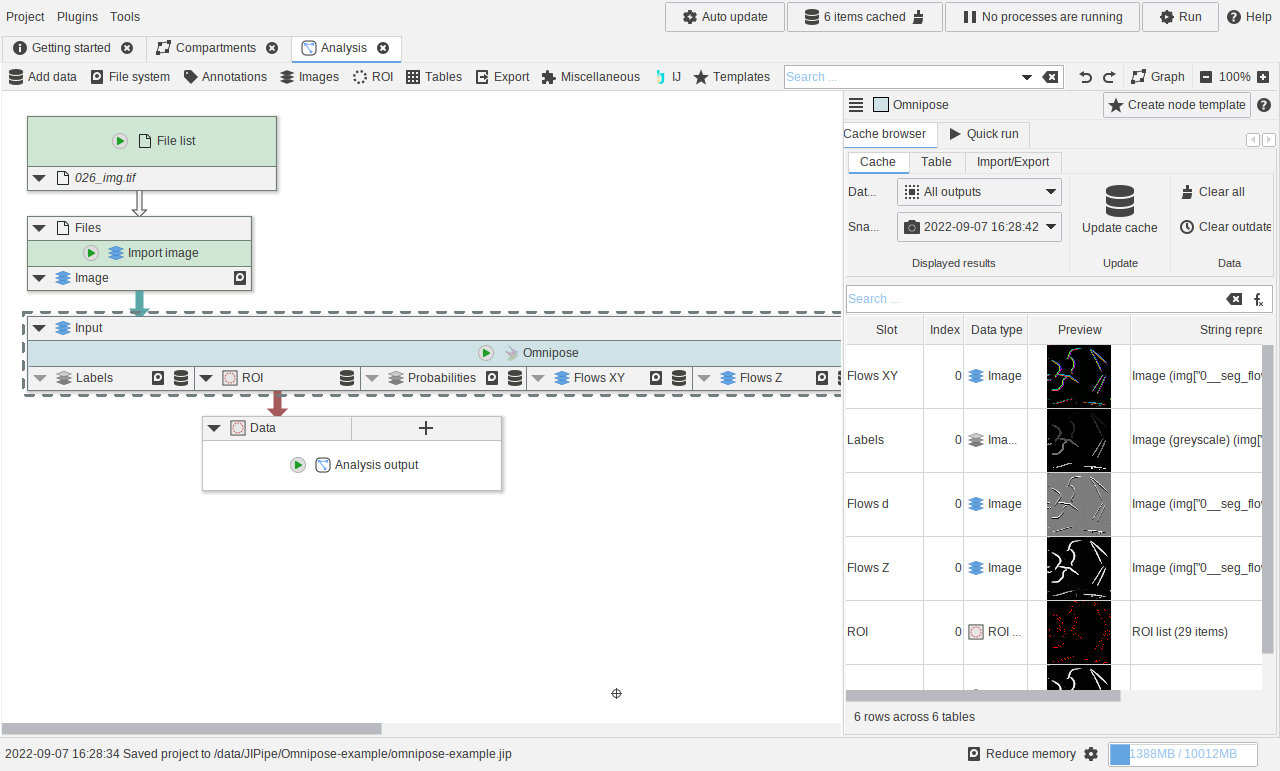
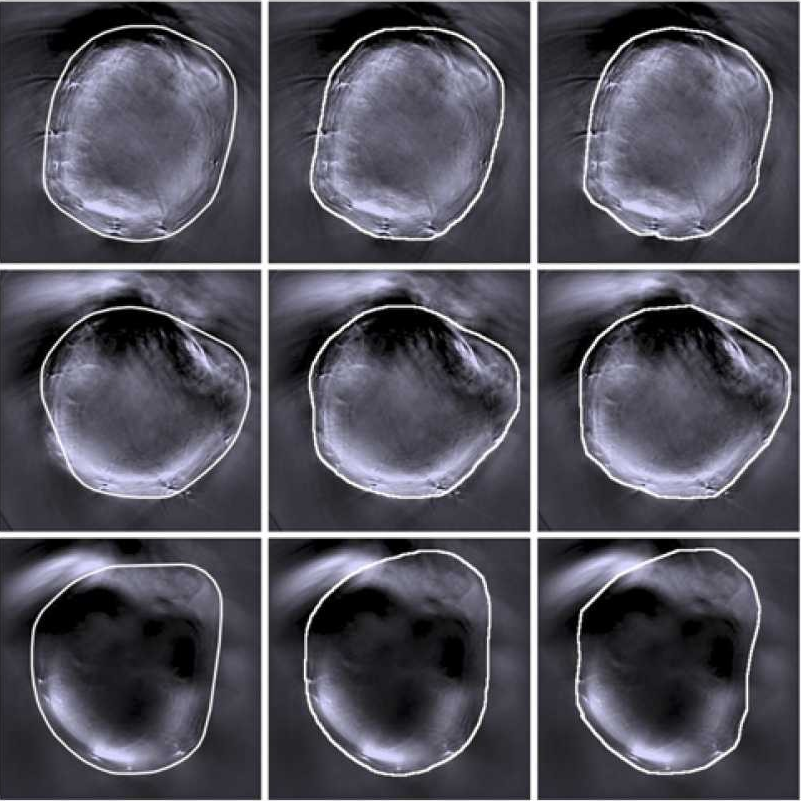
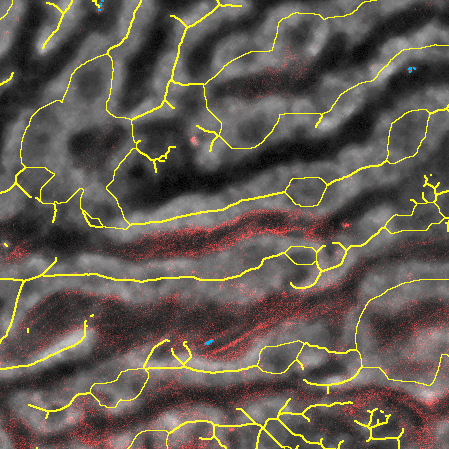
Using the Omnipose segmentation nodes
A small example showcasing how to utilize the Omnipose nodes.
Training of a fully automated pipeline for detecting tissue in MSOT data
For our ‘MSOT cluster analysis toolkit’ (MCAT), we developed a deep-learning-based approach for detecting the mouse tissue. The training was applied in JIPipe via our Cellpose nodes.
Nanoparticle delivery analysis in liver
Micelle nanocarriers were injected into the circulatory system of the mouse vie the tail veins. Two-photon microscopy was utilized to image the cargo delivered by the micelles to the hepatocytes, sinusoids, canaliculi and liver-sinusoidal endothelial cells.
Conversion between ROIs and labels
A small example showcasing nodes for conversion between labels and ROIs and vice versa.
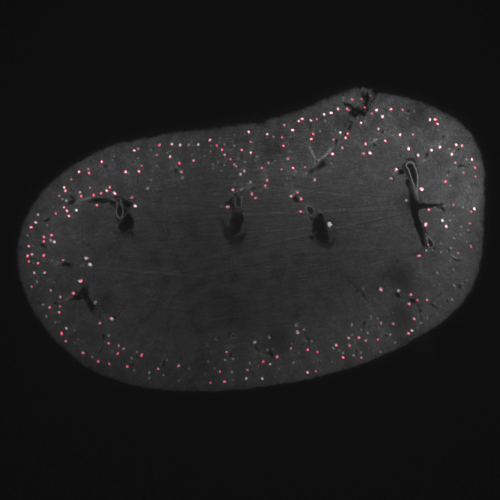
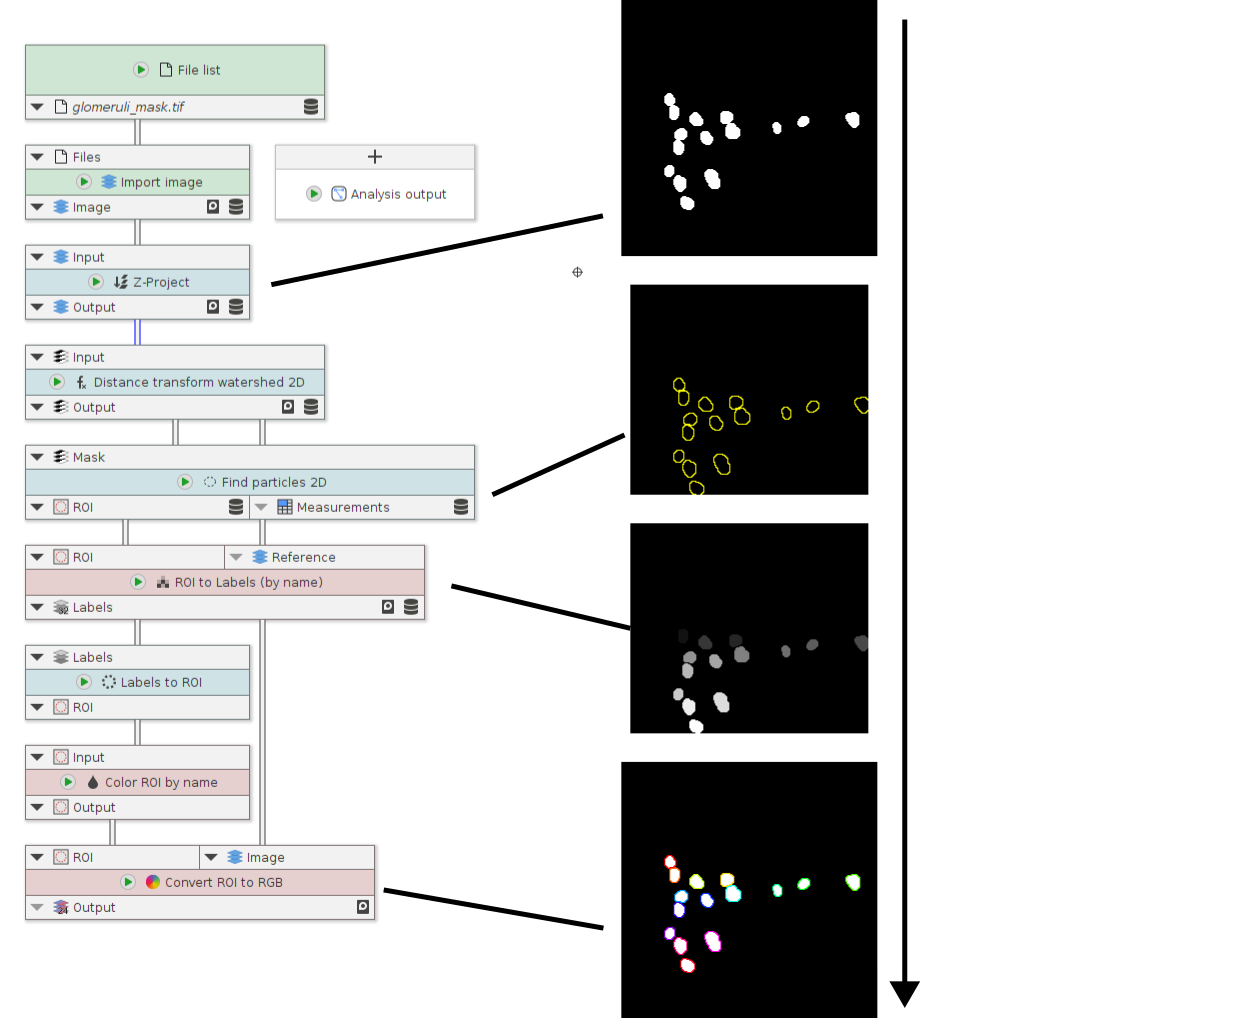
Kidney status check via glomeruli counting
This pipeline analyzes light-sheet fluorescence microscopy of whole murine kidney data. These images were generated with staining specific to glomeruli, functional units of kidney. Here, we reduced the size of the image stack from 700 to 20, which non-workstation computers can process without issues.
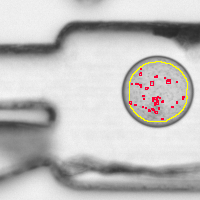
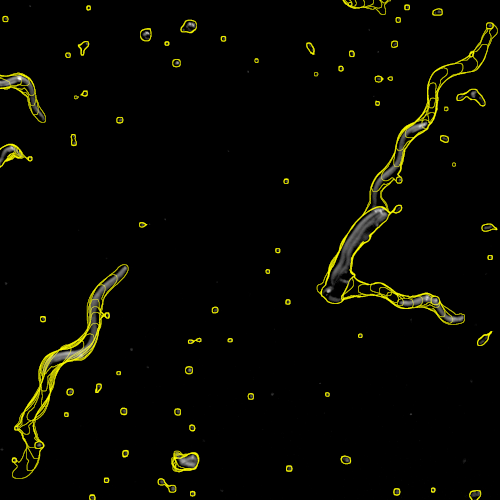
Bacterial growth measured in fluid droplets
Microfluidic droplets of approximately 100 micrometer diameter were filled with a solution containing E. coli bacteria and the bacterial growth was observed via brightfield transmitted light microscopy. This JIPipe workflow finds the droplets that show bacterial growth.
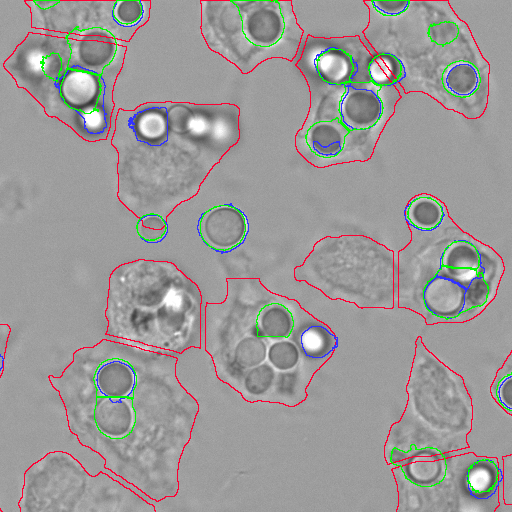
Host-pathogen interactions
Alveolar macrophages were confronted with various species of fungi, including Aspergillus fumigatus and various Lichtheimia species, followed either directly by microscopy, or first by tissue fixation and fluorescence labeling, and then confocal microscopy.
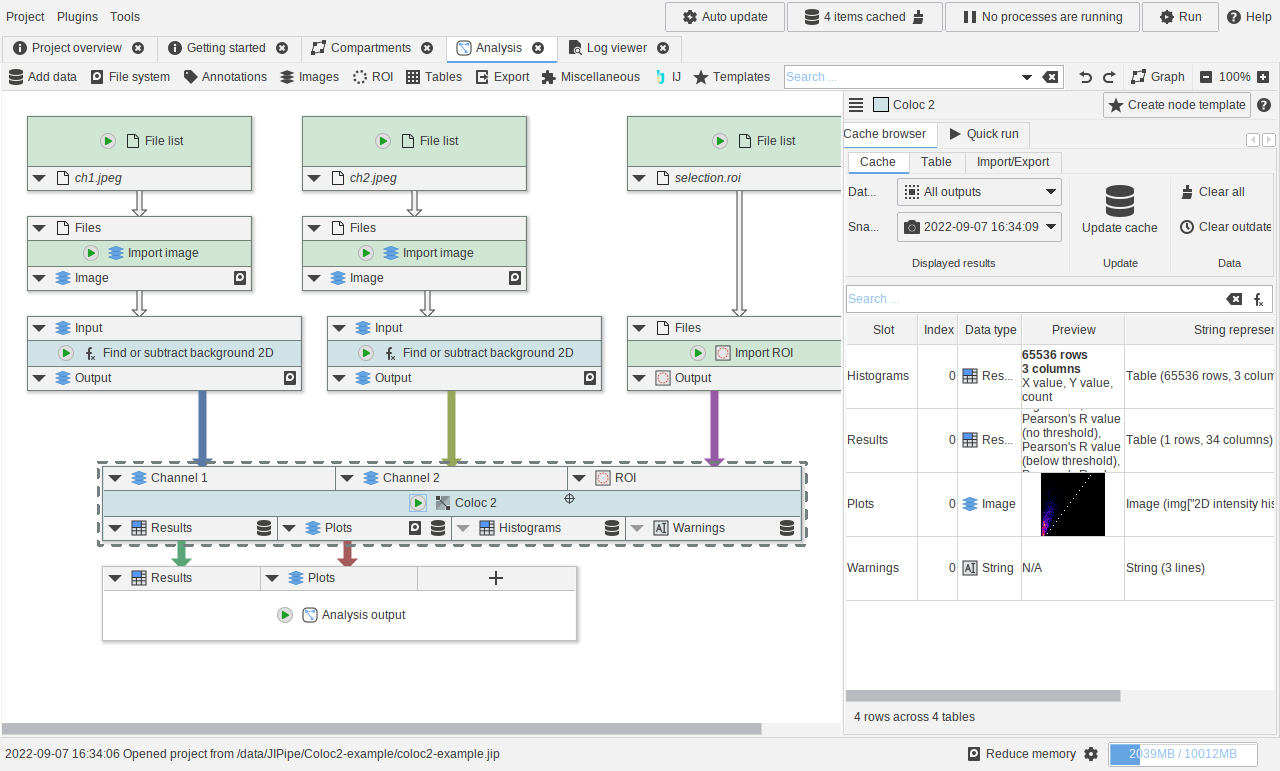
Using the Coloc2 nodes
A small example showcasing how to utilize the Coloc2 nodes.